IMAGE
Fig. 2
Image
Figure Caption
Fig. 2
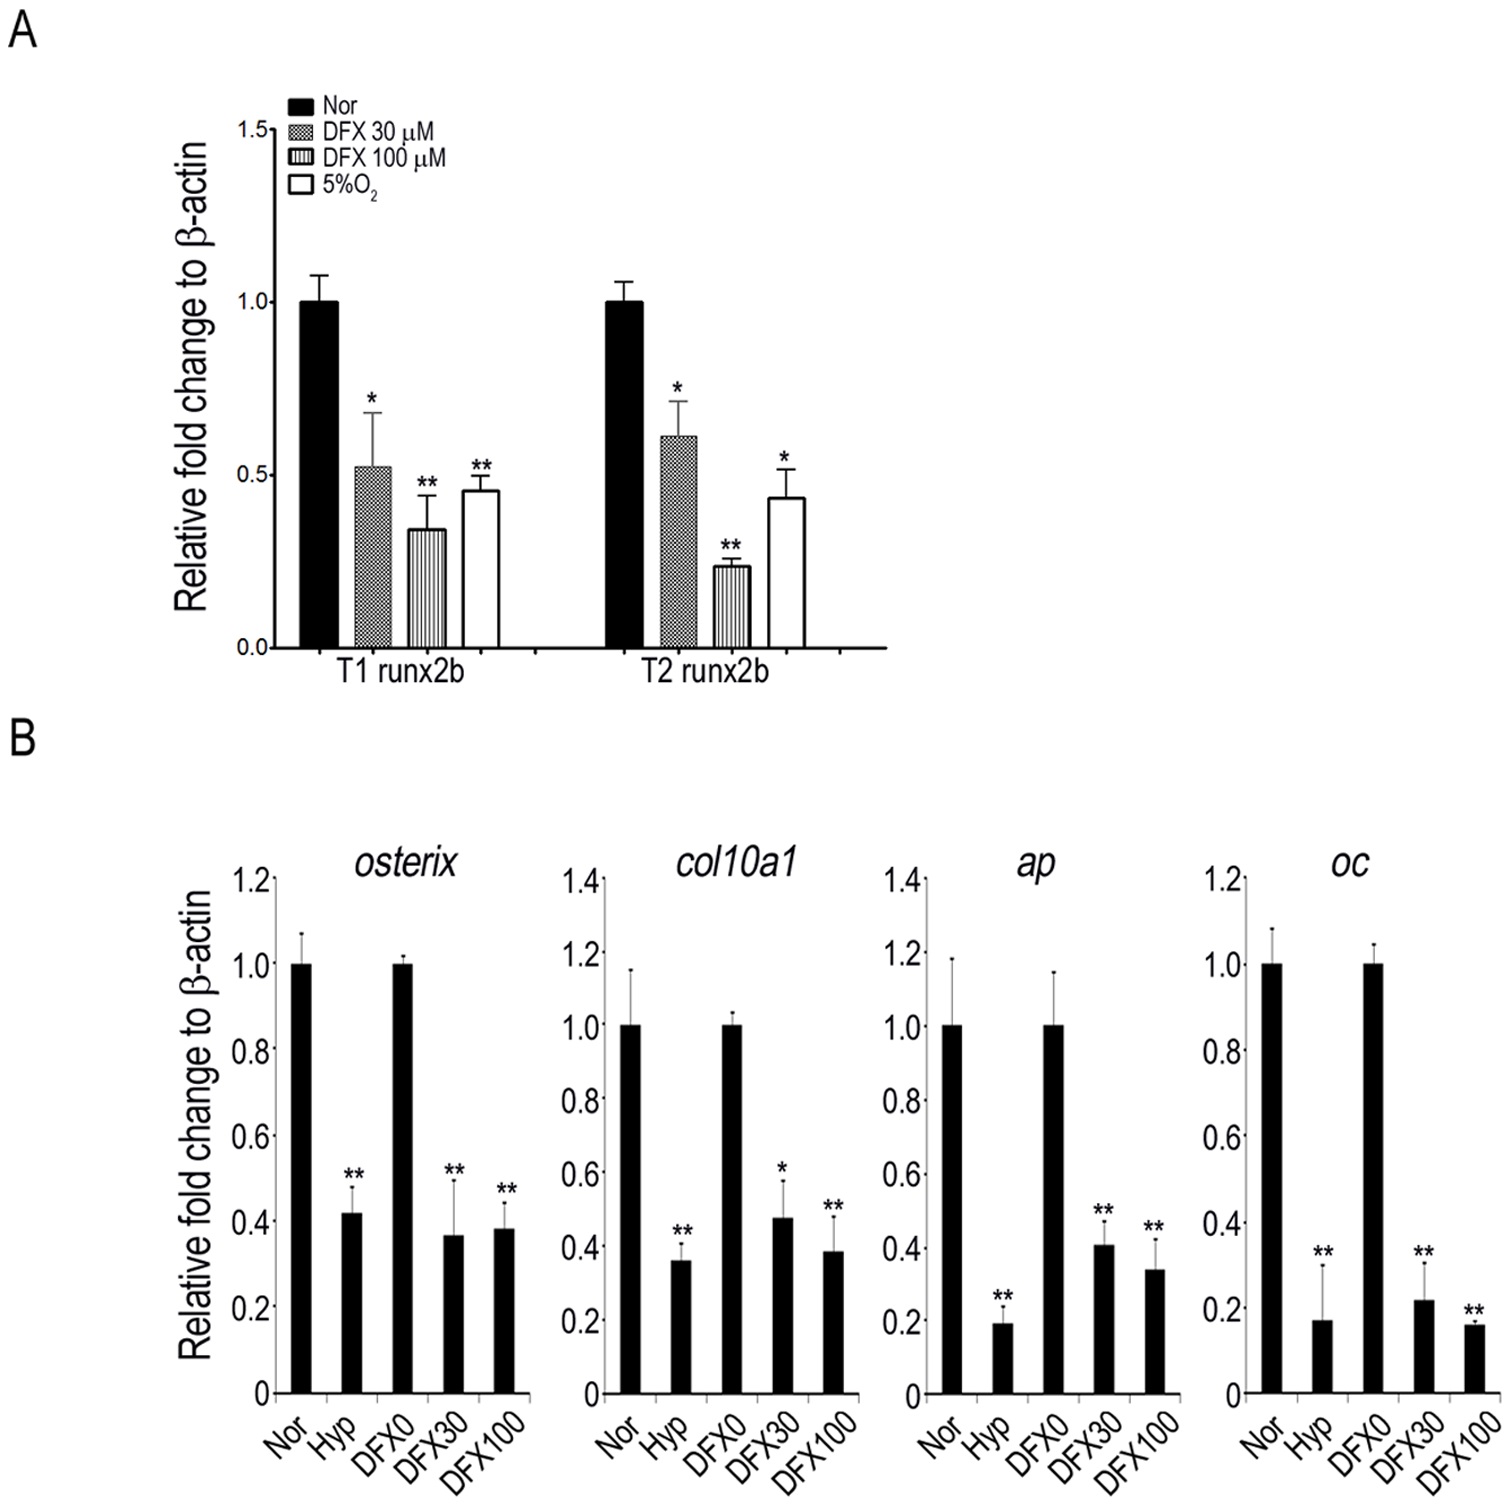
Hypoxia inhibits T1 and T2 runx2b expression in zebrafish.
Zebrafish at 48 hpf were treated with 21% O2, 5% O2 or indicated concentration of DFX for 1 day, and gene expression of T1 and T2 runx2b was assayed by quantitative RT-PCR. Results are shown as relative expression to ²-actin (mean ± SD) and significance was determined by Student′s t-test. (* p<0.05 and ** p<0.01 versus 21% O2).
Figure Data
Acknowledgments
This image is the copyrighted work of the attributed author or publisher, and
ZFIN has permission only to display this image to its users.
Additional permissions should be obtained from the applicable author or publisher of the image.
Full text @ PLoS One

