
|
Fig. 2
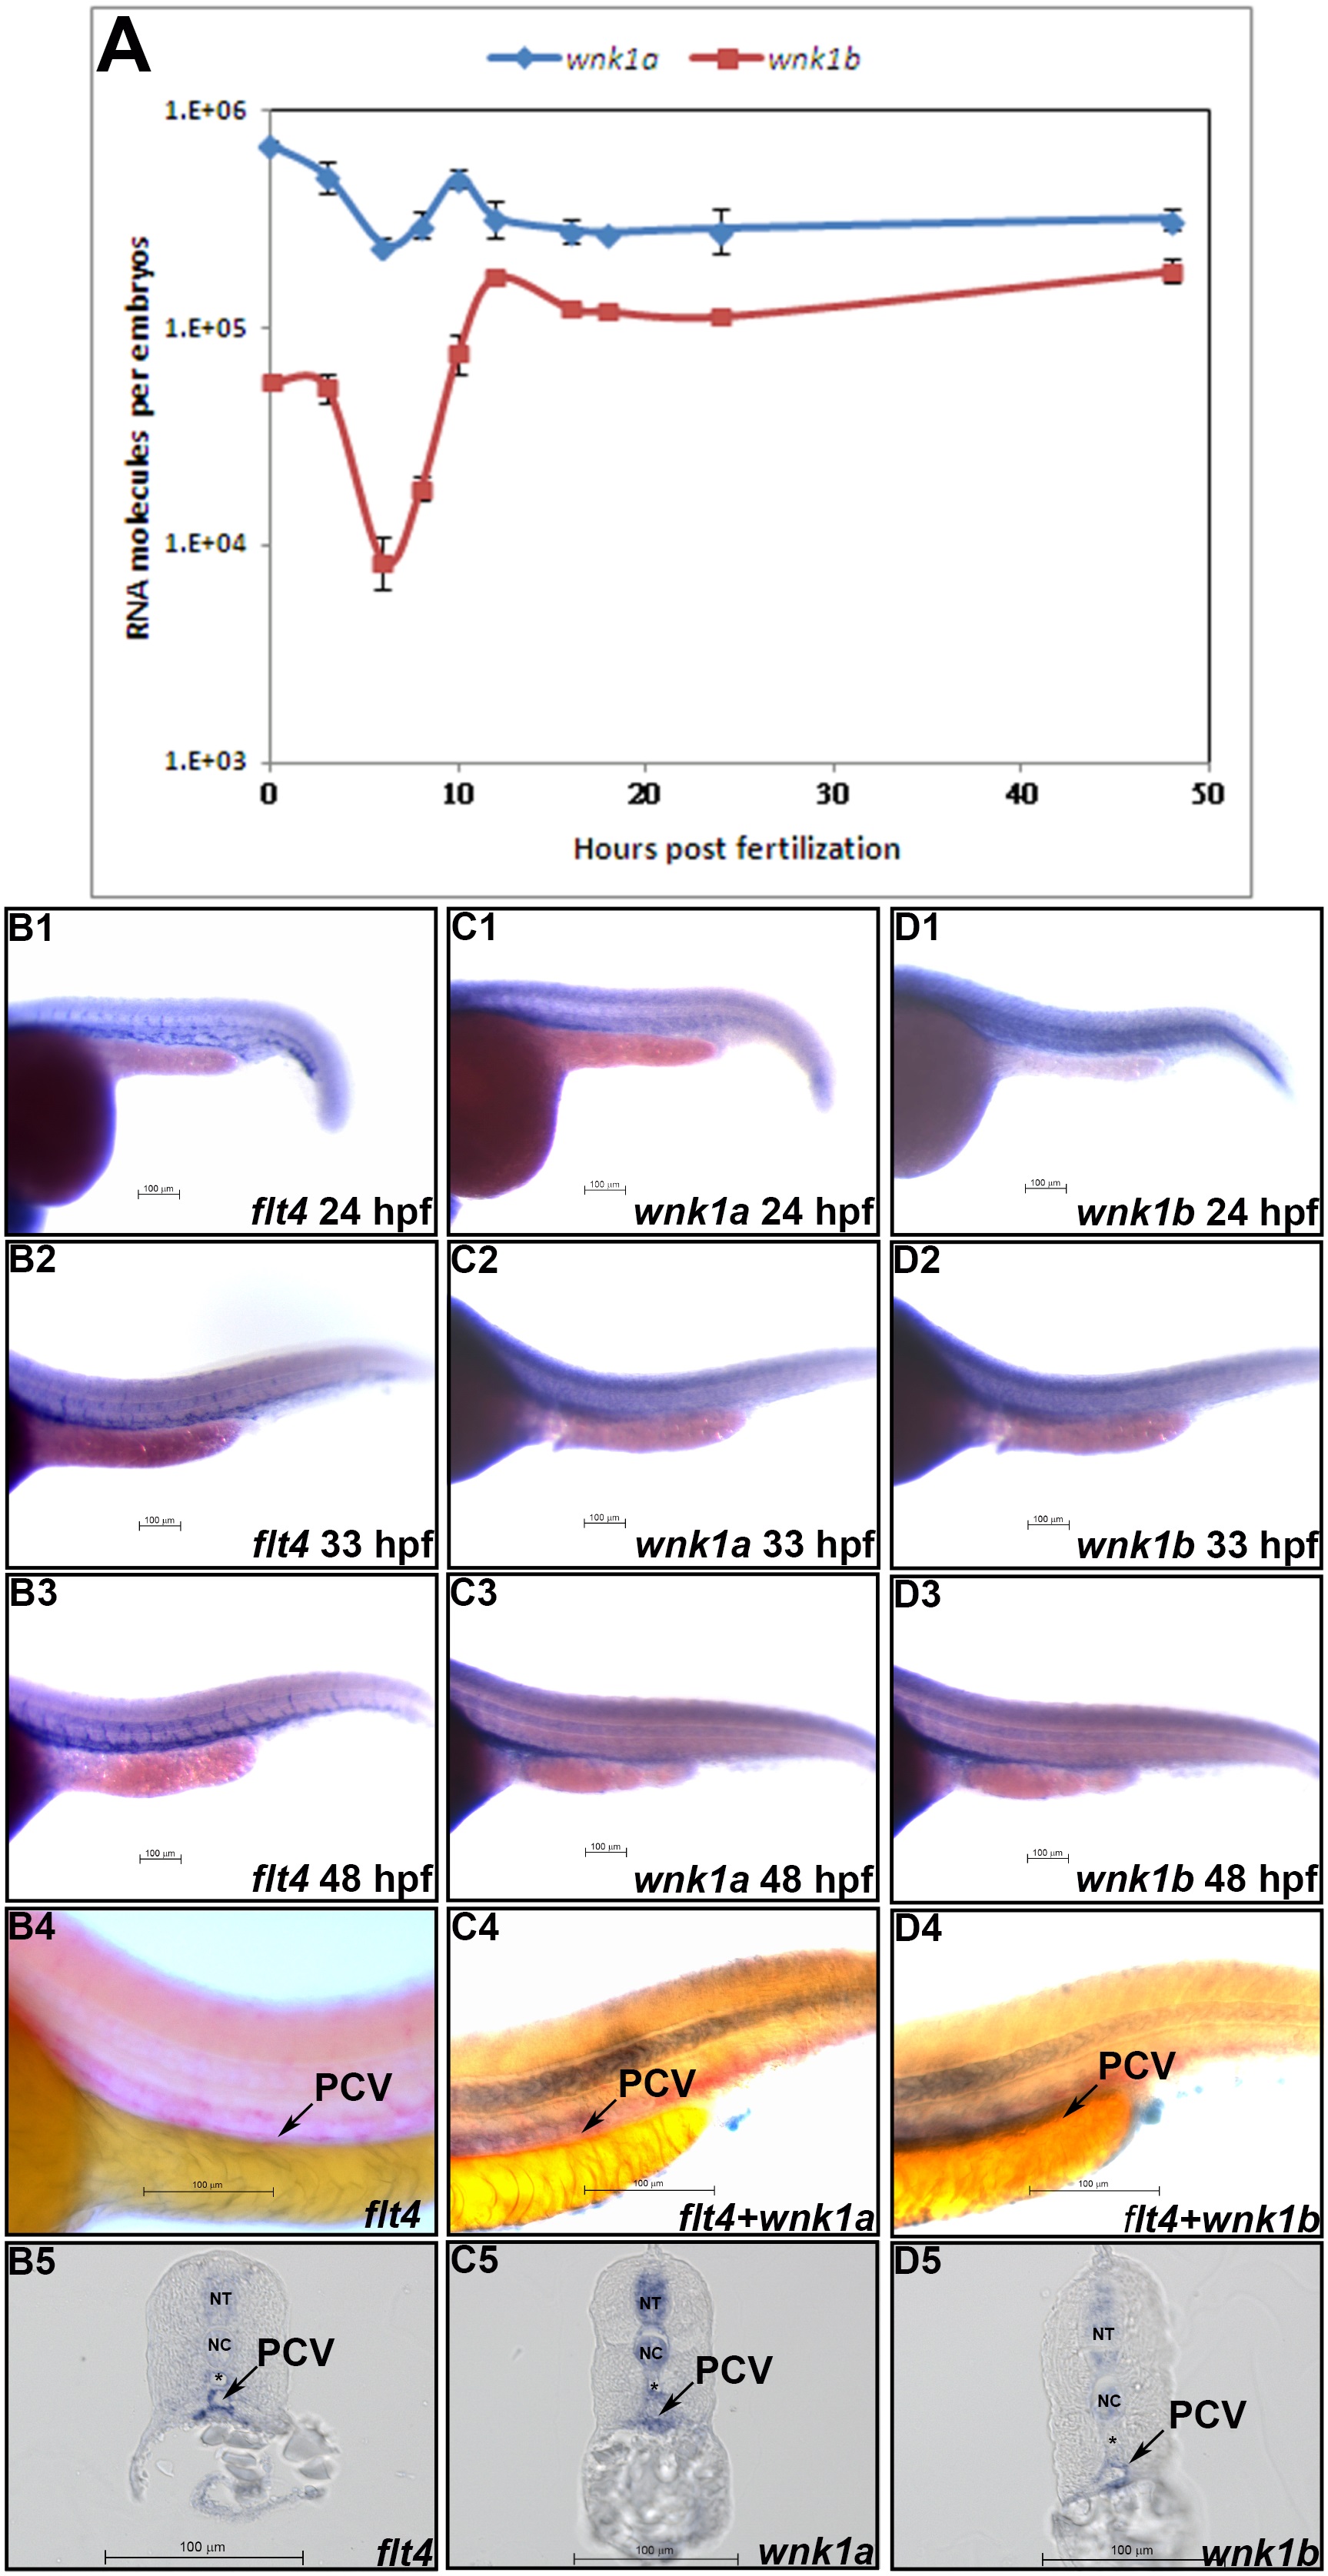
Spatial and temporal expression patterns of wnk1a and wnk1b.
(A) wnk1a and wnk1b mRNA expression profiles as determined by q-RT-PCR. At least three replicates were performed, and the average number of molecules was calculated using a standard curve from a q-RT-PCR assay. The standard deviations are shown in the graph. The red and blue lines indicate the wnk1a and wnk1b expression profiles, respectively. (B