
IMAGE
Fig. S5
Image
|
Figure Caption
Fig. S5
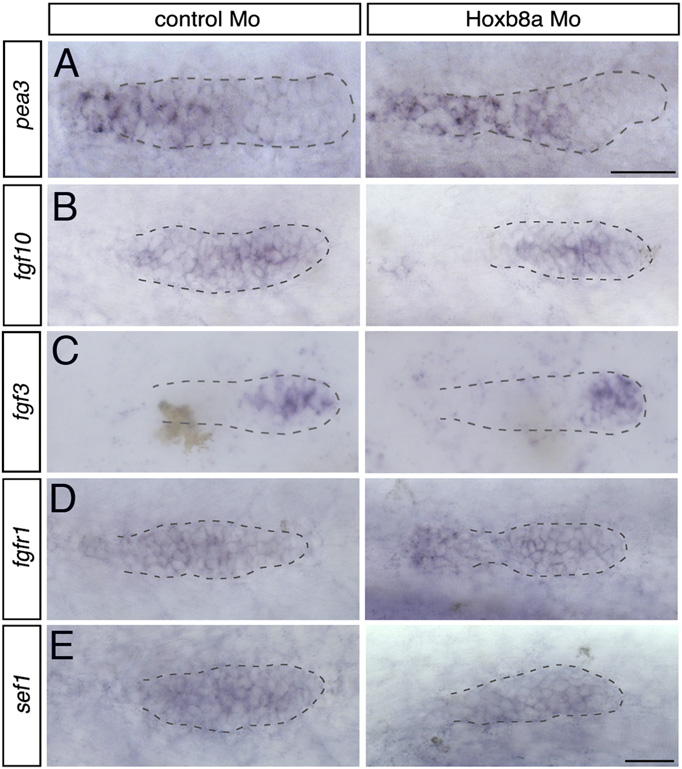
No change in expression of Fgf pathway components in Hoxb8a morpants. ISH to detect expression of (A) pea3, (B) fgf10, (C) fgf3, (D) fgfr1, and (E) sef1 in control and Hoxb8a morphant embryos at 30 hpf. (Scale bars: 25 �m.)
Figure Data
Acknowledgments
This image is the copyrighted work of the attributed author or publisher, and
ZFIN has permission only to display this image to its users.
Additional permissions should be obtained from the applicable author or publisher of the image.
Full text @ Proc. Natl. Acad. Sci. USA