Fig. 5
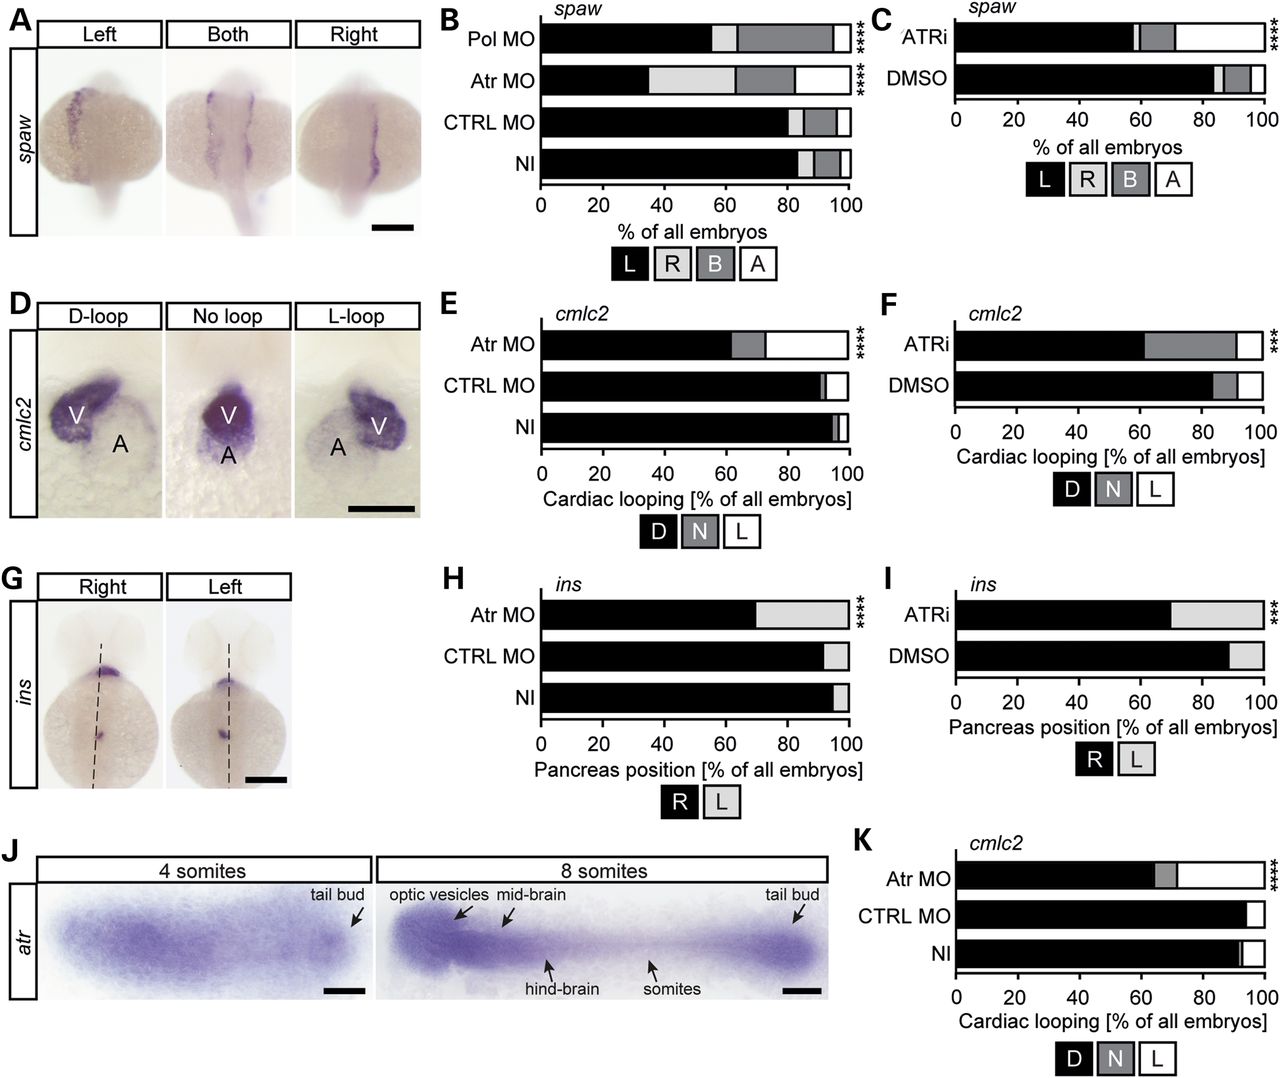
Loss of Atr impairs cilia function in zebrafish. (A) WMISH of 22 ss embryos illustrating southpaw (spaw) expression in the left lateral plate mesoderm (left panel). Ambiguous (middle panel) or right-sided expression (right panel) indicates aberrant left-right asymmetry. Scale bar: 200 Ám. (B) Percentage of embryos with left-sided (L), right-sided (R), ambiguous (B) or no spaw expression upon Atr MO. n= 93-125 embryos; four experiments. P < 0.0001. (C) Chemical inhibition of Atr (ATRi-1) randomizes spaw expression. n = 124-197 embryos; six experiments. P < 0.0001. (D) Representative images of WMISH for cardiac myosin light chain 2 (cmlc2) showing heart looping in 48 hpf embryos. Left panel, a correctly looped heart (D-loop); middle panel, a heart with no looping (no loop); right panel, an inversely looped heart (L-loop). A, atrium; V, ventricle. Scale bar: 100 Ám. (E) Atr depletion impedes heart looping (48 hpf). Stacked bar graph displaying the percentage of embryos with a properly looped heart (D), an unlooped heart (N) or an inversely looped heart (L). n = 94-108; four experiments. P < 0.0001. (F) ATRi-1 inhibitor treatment randomizes cardiac looping similar to that observed in knockdown embryos. n = 106-243; seven experiments. P = 0.009. (G) WMISH for insulin (ins) labelling of pancreatic cells to assess abdominal situs development. Left panel, a dorsal view of a control. The ins expression domain is right of the midline (dashed line). Right panel, pancreas located left of the midline. Embryos were 48 hpf. Scale bar: 200 Ám. (H) Stacked bar graph summarizing correct (R) or wrong-sided (L) expression of ins in injected embryos. n = 94-105 embryos; four experiments. P = 0.001. (I) Aberrant pancreas placement after Atr depletion (48 hpf). n = 118-245 embryos; seven experiments. P = 0.008. (J) Flat mounts of four and eight ss embryos after WMISH for Atr. Note the stronger staining and higher Atr expression in the tailbud region, where the KV forms. Anterior to the left. Scale bars: 150 Ám (four ss) and 200 Ám (eight ss). (K) KV-specific Atr knockdown randomizes cardiac looping. Stacked bar graph of embryos processed for cmlc2 WMISH. n = 66-67 embryos; three experiments. P < 0.0001. Significance was assessed using Fisher′s exact test.

