Fig. 3
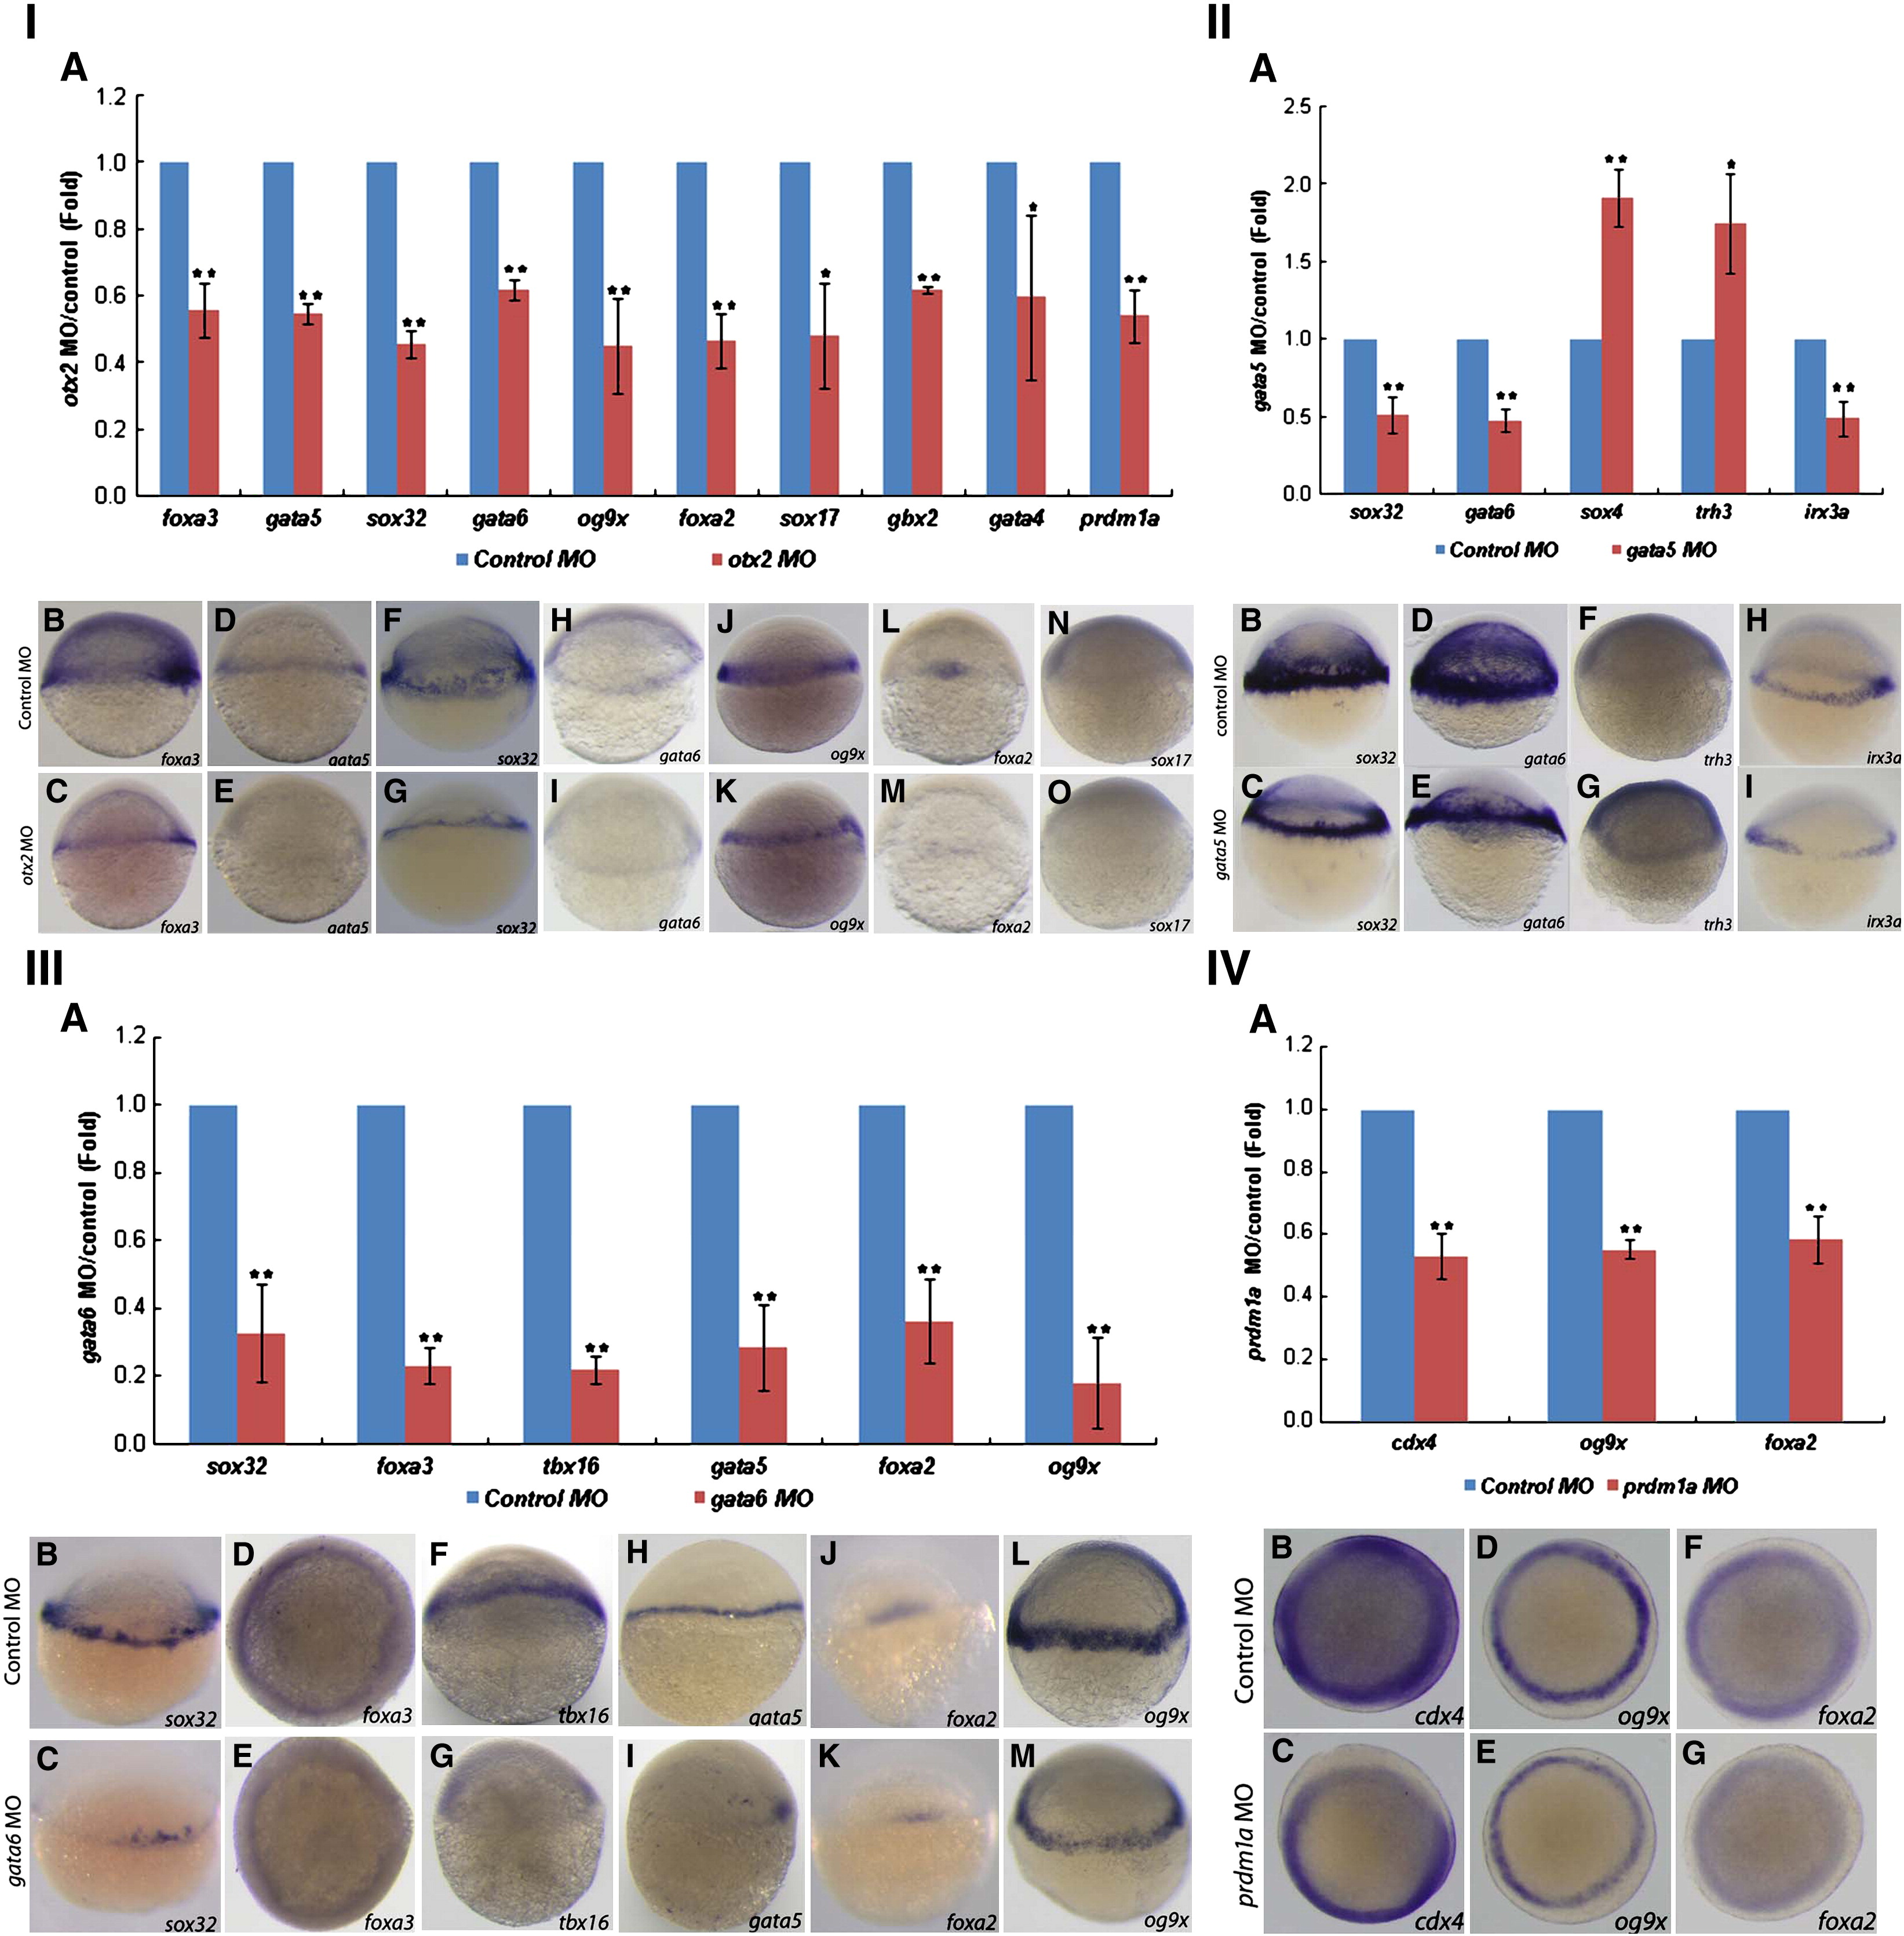
Fig. 3 Genes that are affected after knockdown of otx2 (I), gata5 (II), gata6 (III) and prdm1a (IV) at 5 hpf. (I) otx2 MO represses many genes′ expression at 5 hpf. (II) gata5 MO affect many genes′ expression at 5 hpf. (III) gata6 MO inhibit many genes′ expression at 5 hpf. (IV) prdm1a MO inhibit the expression of cdx4, og9x and foxa2 at 5 hpf. The Q-PCR results from different morphants are shown in bar graphs. The gene expression levels in the control embryos were used as standards and are shown by blue bars. The red bars represent the extent (fold-change) to which gene expression was up- or down-regulated in morphants compared with control embryos. The results were obtained from more than three sample batches, and the standard deviations are indicated as lines extending from the mean. The statistical significance of the quantitative data was determined by the Student′s t-test. ★★, represents p < 0.01, ★, represents 0.01 < p < 0.05. I(B?O), II(B?I), III(B?M), and IV(B?G): Representative images from in situ hybridization show the domains in which the expressed genes were deregulated in morphants. Upper images: expression of the gene (name shown in the right lower corner) in the control MO-injected embryos; lower images: expression of the gene (name shown in the right lower corner) in the otx2 MO (I), gata5 MO (II), gata6 MO (III), and prdm1a MO (IV) injected embryos.
Reprinted from Developmental Biology, 357(2), Tseng, W.F., Jang, T.H., Huang, C.B., and Yuh, C.H., An evolutionarily conserved kernel of gata5, gata6, otx2 and prdm1a operates in the formation of endoderm in zebrafish, 541-57, Copyright (2011) with permission from Elsevier. Full text @ Dev. Biol.

