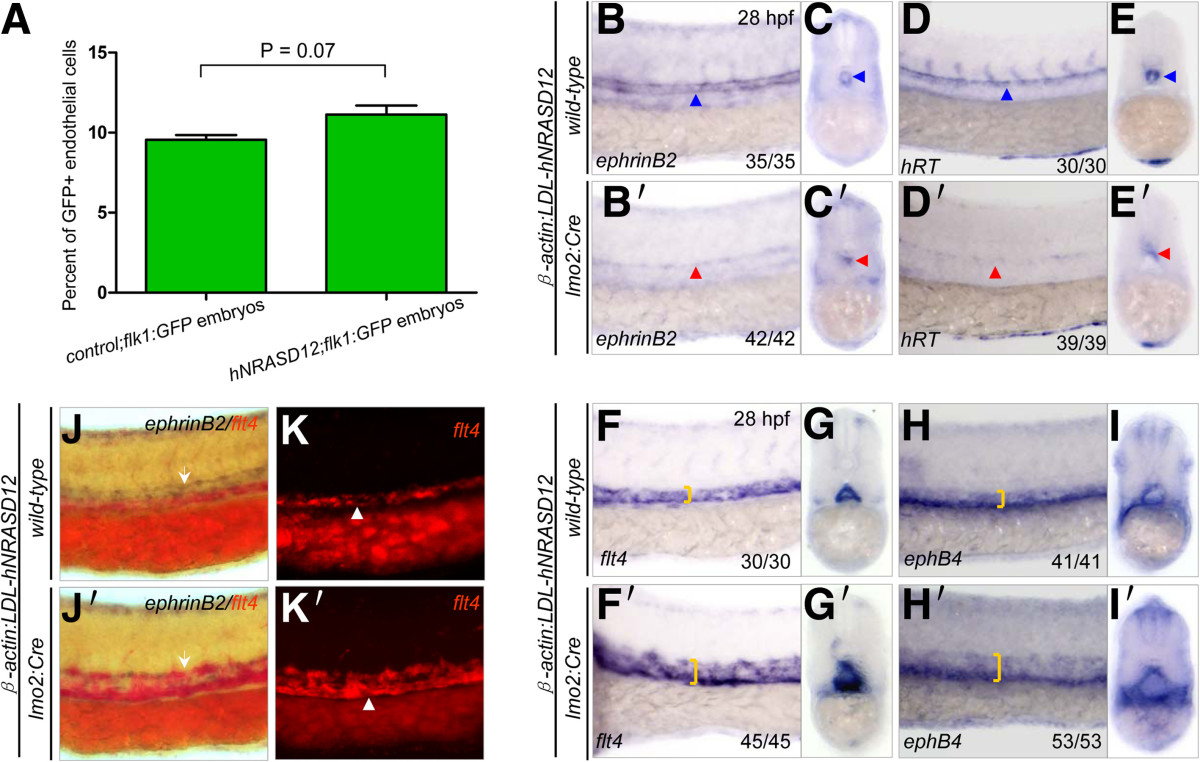
Fig. 6 Expression of hNRASD12 promotes venous specification at the expense of arterial fate during embryonic endothelial differentiation. (A) Quantitation of total endothelial cells by flow cytometry analysis on the control;flk1:GFP and hNRASD12;flk1:GFP embryos at 28 hpf. Representative results obtained from three independent experiments. 2 tailed t-test of frequency of endothelial cells in hNRASD12;flk1:GFP embryos vs control;flk1:GFP embryos shows no significant difference. (B-E′) WISH analysis of ephrinB2+ and hRT+ arterial cells in the trunk of control (B-E, blue triangles) and hNRASD12 embryos (B′-E′, red triangles) at 28 hpf. (F-I′) WISH analysis of flt4+ and ephB4+ venous cells in the trunk of control (F-I) and hNRASD12 embryos (F′-I′) at 28 hpf. The yellow square brackets mark the width of the venous strip in the trunk. (J-K′) 2-color WISH analysis with digoxigenin-labeled ephrinB2 (white arrows) and fluorescein-labeled flt4 (white triangles) in control (J, K) and hNRASD12 embryos (J′, K′) respectively at 28 hpf.
Image
Figure Caption
Figure Data
Acknowledgments
This image is the copyrighted work of the attributed author or publisher, and
ZFIN has permission only to display this image to its users.
Additional permissions should be obtained from the applicable author or publisher of the image.
Full text @ J. Hematol. Oncol.

