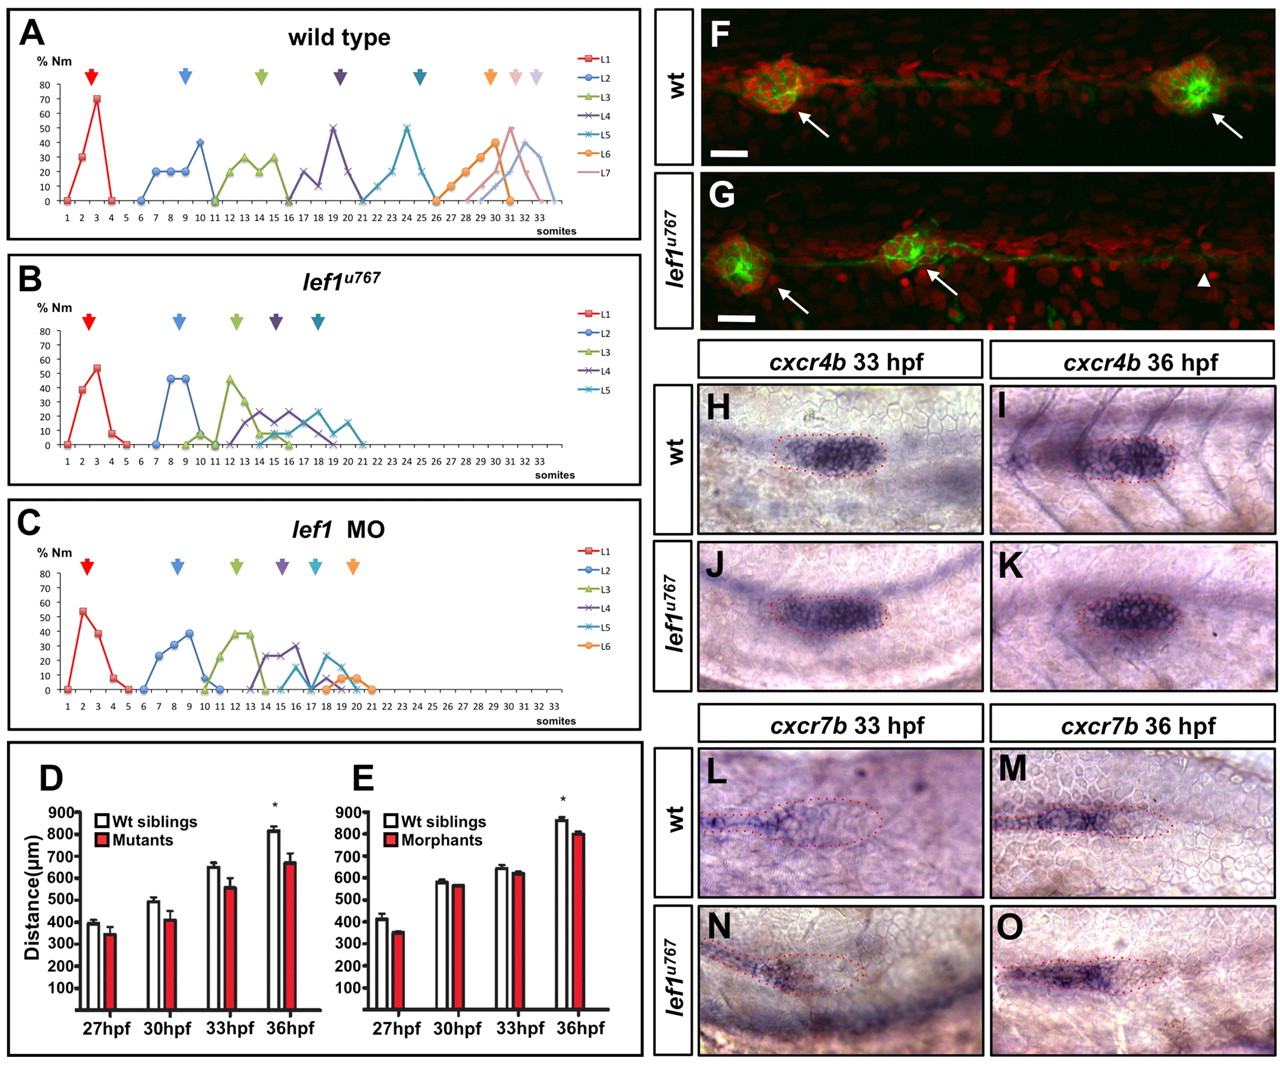
Fig. 2 Neuromast position, primordium kinetics and chemokine receptor expression are unaffected by loss of Lef1 function. (A-C) Histograms depicting the number/position of neuromasts in siblings (A) lef1u767 mutants (B) and lef1 morphants (C) at 3 dpf. Arrows indicate the average position and colours denote the different populations of sequentially deposited neuromasts. (D,E) Plot of the distance (in μm) in lef1u767 mutants (D) and lef1 morphants (E) between the caudal limit of the otic vesicle and the leading edge of the PLLP at 27, 30, 33 and 36 hpf (n=7 mutants/morphants and n=15 wild types in both cases). The only significant difference is observed at 36 hpf (*P<0.01, Wilcoxon rank-sum test). Data are mean+s.d. (F,G) GFP [Tg(-8.0cldnb:lynEGFP)zf106]-positive cells extend beyond the terminal neuromast in 55 hpf lef1u767 embryos (arrowhead). Arrows indicate neuromasts L4 and L5. Nuclei are counterstained with propidium iodide. Scale bar: 20 μm. (H-O) Expression of cxcr4b (H-K) and cxcr7b (L-O) in wild type (H,I,L,M) and lef1u767 mutants (J,K,N,O) at 33 and 36 hpf.
Image
Figure Caption
Figure Data
Acknowledgments
This image is the copyrighted work of the attributed author or publisher, and
ZFIN has permission only to display this image to its users.
Additional permissions should be obtained from the applicable author or publisher of the image.
Full text @ Development

