
Fig. 1
|
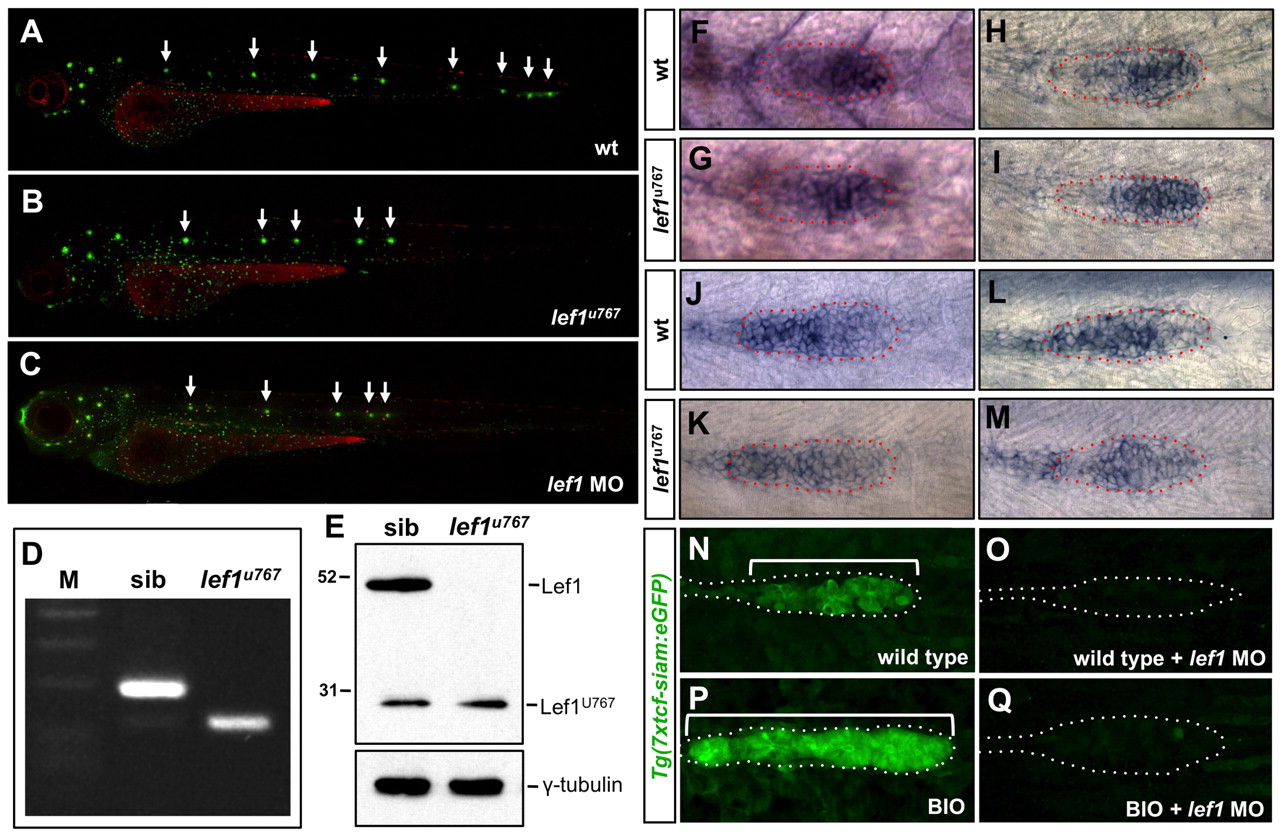
Fig. 1 Characterisation of the zebrafish lef1u767 mutant. (A-C) Lateral views of wild-type (A), lef1u767 (B) and lef1 morphant (C) 3 dpf zebrafish embryos stained with DiAsp/DiOC6. Arrows indicate positions of PLL neuromasts. (D) RT-PCR from sibling and lef1u767 cDNA using primers targeting exons 1 and 3. Mutant lane shows a 121 nucleotide band lacking 67 nucleotides of exon 2. DNA marker lane shows 400, 300, 200 and 100 bp bands. (E) Western blot showing absence of Lef1 band in lef1u767 mutant. (F-M) Expression of lef1 (F,G), tcf7 (H,I), tcf7l1a (J,K) and tcf7l2 (L,M) in wild-type (F,H,J,L) and lef1u767 mutant (G,I,K,M) 33 hpf embryos. Primordia are outlined. (N-Q) GFP expression in control Tg(7Xtcf-siam:GFP)ia4 Wnt reporter (N), lef1 morphant (O), BIO incubated (P) and BIO-incubated/lef1-morphant (Q) 36 hpf embryos. PLLP is outlined in each case. Brackets indicate the length of the primordium.