Fig. 6
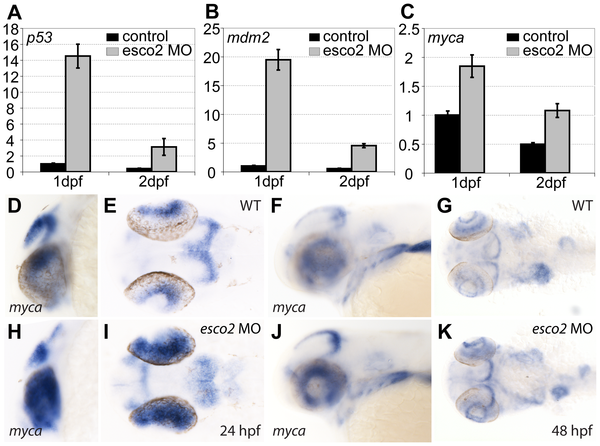
Cell cycle control genes are severely affected in esco2 morphants.
A?C, qPCR at 1 and 2 dpf showing significantly increased mRNA abundance in esco2 morphants of p53 (A) and mdm2 (B), and increased mRNA levels of myca (C). D?K, In situ hybridization with a myca probe at 24 hpf and 48 hpf. Note the strong expression in the eyes of esco2 morphants (H) compared with wild type (D) and the abnormal expression in the brain (I compared with wild type in E) at 24 hpf. At 48 hpf myca expression seemed to be slightly increased in the brain of esco2 morphants (J, K compared with wild type in F, G) but was expressed in a normal pattern. D, H, F, J, lateral views, E, I, G, K, dorsal views. Anterior is to the left.

