
Fig. 2
|
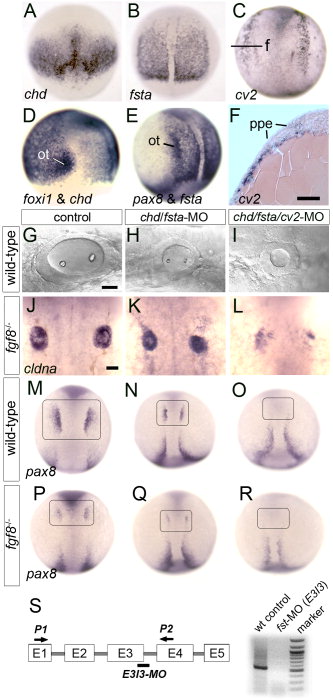
Fig. 2 Loss of Bmp-antagonists impairs otic induction. A, D: Expression of chd at 7.5 hpf, dorsal view (A), and chd and foxi1 at 9 hpf, lateral view (D). The preotic domain of foxi1 is indicated (ot). B, E: Expression of fsta at 10 hpf, dorsal view (B) and fsta and pax8, lateral view (E). The preotic domains of pax8 is indicated (ot). C, F: Expression of cv2 at 10.5 hpf as shown in a whole-mount specimen, dorsal view (C) and in cross section (F). The plane of section (f) and preplacodal ectoderm (ppe) are indicated. G?I: Otic vesicle at 26 hpf in a wild-type control (D), chd/fsta double-morphant (E), and chd/fsta/cv2 triple-morphant (F). J?L: Dorsal views of cldna expression in otic cells at 27 hpf in an fgf8-/- mutant (J), fgf8-/- mutant injected with chd/fsta-MO (K), and fgf8-/- mutant injected with chd/fsta/cv2-MO (L). M?R: Dorsal views of pax8 expression in pre-otic cells at 11 hpf (boxed area) in a wild-type control (M), chd/fsta double-morphant (N), chd/fsta/cv2 triple-morphant (O), fgf8-/- mutant (P), fgf8-/- mutant injected with chd/fsta-MO (Q), and fgf8-/- mutant injected with chd/fsta/cv2-MO (R). Anterior is to the top in all images except G?I in which anterior is to the left. Scale bar = 25 μm. S, schematic diagram of the fsta exon/intron structure, the fsta-MO2 target site (bar), primer-binding sites used for RT-PCR (P1, P2 arrows), and the results of RT-PCR confirming that fsta-MO2 injection severely reduces fsta transcript levels.