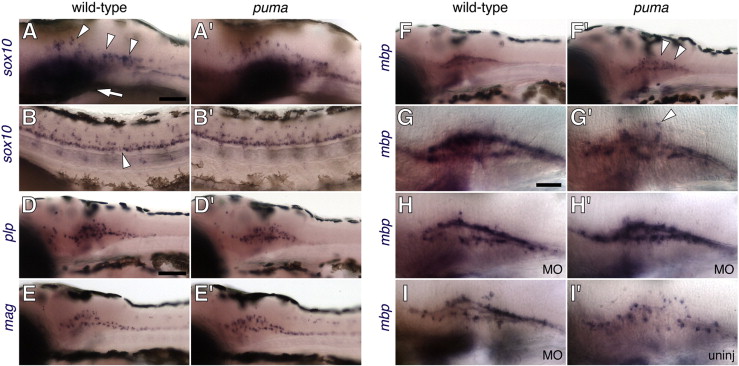
Fig. 9 Normal oligodendrocyte early differentiation but defective morphogenesis in puma mutant early larvae and rescue of puma mutant phenotype by morpholino knockdown. All panels are of 5 dpf larvae with anteriors to the left. (A, A′, B, B′) sox10 is expressed similarly in wild-type and puma mutants both in the brain (A, A′) and in the spinal cord (B, B′). Arrowheads in A, dispersed sox10+ cells within the brain. Arrow in A, more superficial sox10 staining within cranial ganglia. Arrowhead in B, sox10+ cells in the ventral spinal cord. (D, D′, E, E′) plp and mag expressions are similar between wild-type and puma mutants as well, with mRNA staining localizing principally to cell bodies. (F, F′) mbp staining, however, differs between genotypes, with wild-type mbp+ transcript detectable principally in oligodendrocyte processes, rather than in cell bodies, whereas in puma mutants, transcript is present both within processes and in cell bodies. (G, G′) Higher magnification view of different embryos, showing in wild-type compact and organized mbp staining in myelinating processes, but in puma mutants diminished staining in processes and greater staining in cell bodies (arrowhead). Although tuba8l3a expression in embryos was consistent with that of a maternally derived transcript, neither mbp mis-patterning at 5 dpf nor other phenotypes segregated as would be predicted for a maternal effect mutation (data not shown). (H) Morpholino knockdown of tuba8l3a results in moderate perturbations to mbp staining in wild-type larvae. (H′) In contrast, knockdown of tuba8l3a in puma mutants restores a wild-type pattern of mbp staining. (I) Partial disruption of mbp staining in another wild-type morphant. (I′) An uninjected puma mutant larva from the same clutch as the individual in H′, stained for the same duration. Morpholino dosages in H, H′, I: 0.5 ng tuba8l3a-tb1; similar results were observed with tuba8l3a-tb2 (data not shown). Scale bars: in A, 60 μm for A, A′, B, B′; in D, 100 μm for D, D′, E, E′, F, F′; in G, 40 μm for G, G′, H, H′, I, I′.
Reprinted from Developmental Biology, 346(2), Larson, T.A., Gordon, T.N., Lau, H.E., and Parichy, D.M., Defective adult oligodendrocyte and Schwann cell development, pigment pattern, and craniofacial morphology in puma mutant zebrafish having an alpha tubulin mutation, 296-309, Copyright (2010) with permission from Elsevier. Full text @ Dev. Biol.

