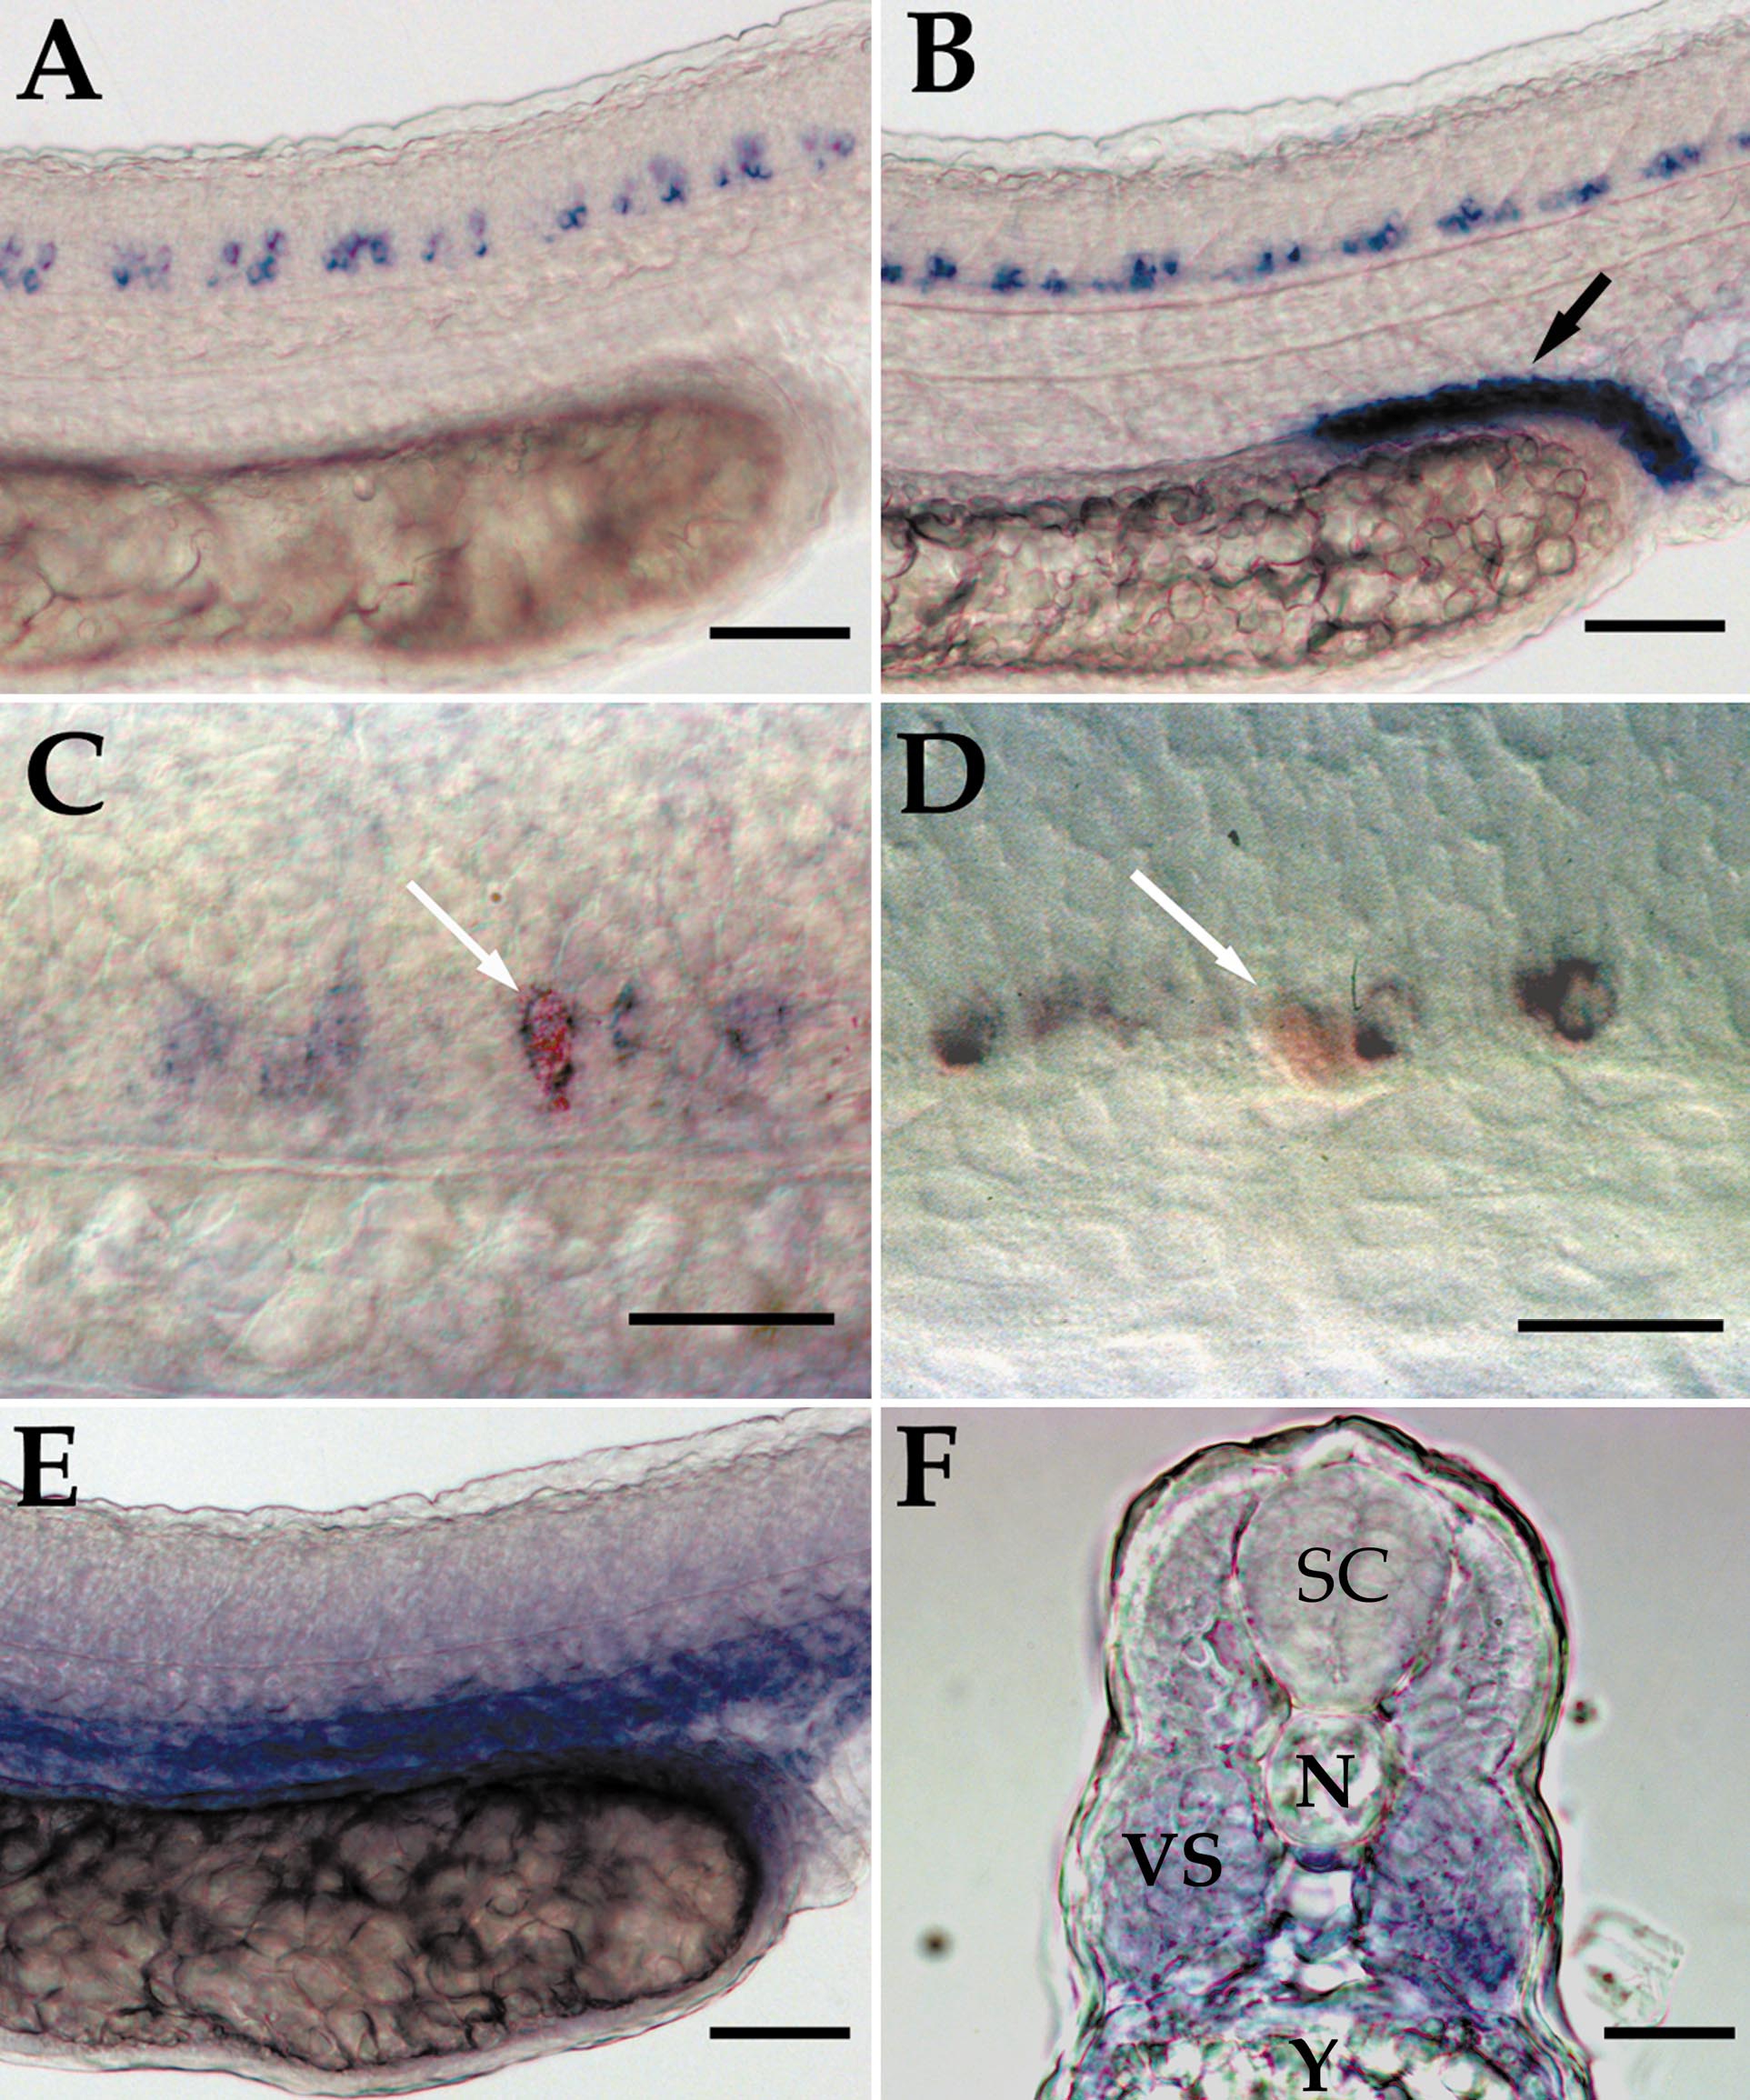
Fig. 2 Expression of zebrafish GDNF, GFRα1b, and RET genes in the trunk of 24 hpf embryos (A and B). Low power lateral views of the trunks of 24 hpf embryos hybridized with riboprobes for GFRα1b (A) and RET (B). (C, D) High power lateral views of whole-mount 24 hpf embryos hybridized with GFRα1b riboprobe (blue reaction product) that had been injected with lysinated fluorescence dextran (red reaction product) to identify CaP (C) and MiP (D) PMN prior to in situ hybridization. Low power lateral view of the trunk of 24 hpf embryos hybridized with riboprobes for GDNF (E). Transverse section taken through a 24 hpf embryo hybridized with probe for GDNF at the level of somite 14. SC, spinal cord; N, notochord; VS, ventral somite; Y, yolk. Arrow in (B) indicates pronephric duct. Arrows in (C) and (D) indicate the identified PMN. In (A?E) rostral is to the left. Scale bars: (A), (B), (E), and (F), 50 μm; (C) and (F), 25 μm.
Reprinted from Developmental Biology, 231(2), Shepherd, I.T., Beattie, C.E., and Raible, D.W., Functional analysis of zebrafish GDNF, 420-435, Copyright (2001) with permission from Elsevier. Full text @ Dev. Biol.

