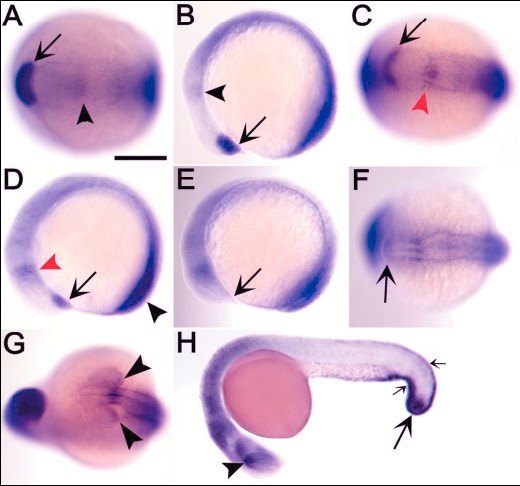
Fig. 3 Expression of zebrafish tcf7 during somitogenesis. A,B: The five-somite stage. Arrows indicate expression in prechordal plate, and arrowheads indicate expression in diencephalon/mesencephalon boundary. A: Dorsal view, anterior to left. B: Lateral view, anterior to left. C,D: The eight-somite stage. Specific expression seen in diencephalon/mesencephalon boundary (red arrowheads), polster (arrows), and tail bud (black arrowhead). C: Dorsal view, anterior to left. D: Lateral view, anterior to left. E,F: The 12-somite stage. Expression of tcf7 is absent in polster (arrows). E: Lateral view, anterior to left. F: Dorsal view, anterior to left. G: The 15-somite stage showing expression in dorsal retina (arrowheads). Frontal view. H: Embryo at 24 hr postfertilization (hpf) showing expression in dorsal retina (arrowhead), tail bud (large arrow), and median fin fold (small arrows). Lateral view, anterior to left. Scale bar in A = 300 μm in A-G, 500 μm in H.
Image
Figure Caption
Figure Data
Acknowledgments
This image is the copyrighted work of the attributed author or publisher, and
ZFIN has permission only to display this image to its users.
Additional permissions should be obtained from the applicable author or publisher of the image.
Full text @ Dev. Dyn.

