|
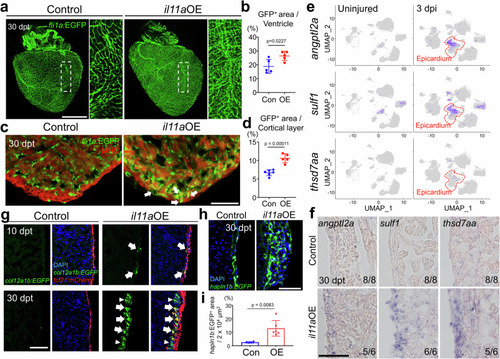
il11a induction stimulates vascularization in the absence of injury. a Representative whole-mount images of 30 dpt fli1a:EGFP hearts from control and il11aOE. Insets correspond to higher magnifications of dashed boxes. b Quantification of fli1a:EGFP+ vessel area in the ventricles for control Con and il11aOE. Biological replicates = 5 for control and il11aOE. c Representative cardiac section images of 30 dpt control and il11aOE hearts. Green and red indicate fli1a:EGFP and myosin heavy chain (MHC), respectively. Arrows indicate expanded EGFP+ region in the cortical layer. d Quantification of EGFP+ area in the cortical muscle layer from Con and il11aOE. Biological replicates = 6 and 5 for control and il11aOE, respectively. e Gene expression plots of angptl2a, sulf1, and thsd7aa induced in epicardium at 3 days post injury (dpi). Cells expressing the indicated gene are colored purple, and the relative intensity indicates relative expression levels. Red dashed lines indicate epicardial expression of indicated genes. uniform manifold approximation and projection (UMAP) clustering with annotated cell-types are in Supplementary Fig. 6. f Representative images of in situ hybridization (ISH) for angiogenic factors (angptl2a, sulf1, thsd7aa) on cardiac sections of control and il11aOE. The number in the lower right corner of each image represents the fraction of the analyzed hearts with displayed phenotype. Biological replicates = 6 and 8 for control and il11aOE, respectively. g Representative cardiac section images of control and il11aOE expressing tcf21:mCherry; col12a1b:EGFP. Top, 10 dpt. Bottom, 30 dpt. Blue, DAPI. Green, EGFP. Red, mCherry. Arrows indicate tcf21:mCherry and col12a1b:EGFP double positive cells. Arrowheads indicate tcf21:mCherry-; col12a1b:EGFP+ cells. h Representative cardiac section images of 30 dpt control and il11aOE hearts. Green indicates hapln1b:EGFP. i Quantification of hapln1b:EGFP+ area in the cortical muscle layer from Con and il11aOE. Biological replicates = 4 and 6 for control and il11aOE, respectively. Scale bars, 500 µm in (a), 50 µm in (c), (f), (g), and (h). Data are mean ± SEM in (b), (d), and (i). p-values were determined by unpaired two-tailed t-test in (b), (d), and (i).
|