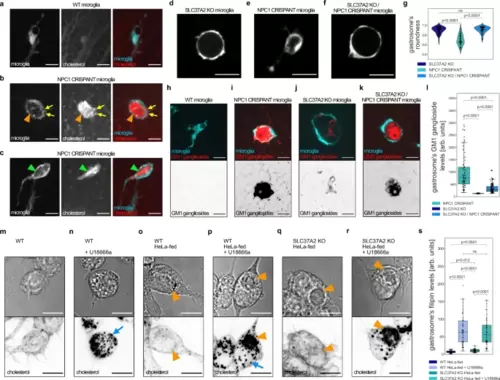
Gastrosome in NPC1 deficient cells accumulates cholesterol and GM1 gangliosides.a?c Representative images of OT microglia (TgBAC(csf1ra:GAL4-VP16), Tg(UAS-E1B:NTR-mCherry)) with TopFluor cholesterol. Scale bar 10 �m. b Orange arrowhead indicates gastrosome and yellow arrows point to smaller cholesterol-rich vesicles. c Green arrowhead points to a visible cholesterol crystal. d?f Representative images of OT microglia (TgBAC(csf1ra:GAL4-VP16), Tg(UAS-E1B:NTR-mCherry)). Scale bar 20 �m. g Roundness of the gastrosome in SLC37A2 KO (N = 3, n = 69), NPC1 CRISPANT (N = 4, n = 59) and NPC1 CRISPANT in SLC37A2 KO background (N = 4, n = 61) in OT microglia (TgBAC(csf1ra:GAL4-VP16), Tg(UAS-E1B:NTR-mCherry)). N refers to the number of zebrafish embryos and n to the number of microglia examined. h?k, Representative images of OT microglia (TgBAC(csf1ra:GAL4-VP16), Tg(UAS-E1B:NTR-mCherry)) fixed and stained for GM1 gangliosides. Scale bar 10 �m. l GM1 ganglioside levels in the gastrosome from NPC1 CRISPANT (N = 9, n = 68), SLC37A2 KO (N = 7, n = 69) and NPC1 CRISPANT in SLC37A2 KO background (N = 9, n = 120) fixed OT microglia. N refers to the number of zebrafish embryos and n to the number of microglia examined. m?r Representative images of RAW macrophages stained with filipin. Scale bar 10 �m. Blue arrows point to cholesterol-rich small vesicles while the orange arrowheads indicate the gastrosome. s Filipin levels in the gastrosome of RAW macrophages: WT HeLa-fed (n = 40), WT HeLa-fed and U18666a treated (n = 54), SLC37A2 KO HeLa-fed (n = 30), SLC37A2 KO HeLa-fed and U18666a treated (n = 50). n refers to the number of cells examined. Boxplots represent the median value and interquartile range; the ends of the whiskers correspond to the minimum and maximum values. Statistical tests: Mann-Whitney-Wilcoxon test two-sided with Bonferroni correction. ns without any additional p-value on the graph stands for p = 1. OT stands for optic tectum. Source data are provided as a Source Data file.
|
