
FIGURE
Fig. 4
- ID
- ZDB-FIG-240916-129
- Publication
- Zhong et al., 2024 - Functional Insights in PLS3-Mediated Osteogenic Regulation
- Other Figures
- All Figure Page
- Back to All Figure Page
Fig. 4
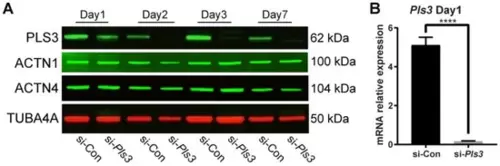
PLS3 knockdown in MLO-Y4 cells. (A) PLS3, ACTN1, and ACTN4 expression determined by Western blotting analysis from day 1 to 7 after the transfection. TUBA4A was used as a loading control. (B) Pls3 mRNA expression after 24 h of transfection. Tbp was used to normalize gene expression. si-Pls3: small interfering Pls3. (Error bars indicate standard deviation, **** p < 0.0001). |
Expression Data
Expression Detail
Antibody Labeling
Phenotype Data
Phenotype Detail
Acknowledgments
This image is the copyrighted work of the attributed author or publisher, and
ZFIN has permission only to display this image to its users.
Additional permissions should be obtained from the applicable author or publisher of the image.
Full text @ Cells