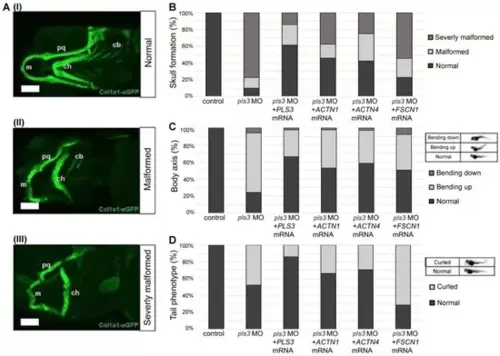
Actinin-1 and Actinin-4 rescue malformation of craniofacial bone structure, body axis, and tail in 5-day-old col1a1:eGFP zebrafish with pls3 morpholino (pls3 MO). (A) Overview of different observed phenotypes of developing skeletal elements in col1?1:eGFP fish (cartilage green) with and without pls3 MO knockdown. Phenotype is subdivided into three different types of severity: (I) normal: all structures are present and developed normally; (II) malformed: m, ch, and pq are shorter and partially malformed; (III) severely malformed: m, ch, and pq are shorter and partially malformed, some cb are absent. (m: Meckel?s cartilage; ch: ceratohyal; pq: palatoquadrate; cb: ceratobranchial). (B) Statistical analysis of phenotypes of control fish compared to knockdown and rescue fish. Control fish show 100% normal skull development, which is significantly reduced to 10.11% in 0.8 mM pls3 MO-treated fish (p < 0.0001). This effect is rescued by co-injection of 300 pg human PLS3, ACTN1, and ACTN4 mRNA (61.43%, 45.90%, and 42.30% normal skull, respectively, compared to pls3 MO: p < 0.0001). Co-injection of FSCN1 mRNA showed 22.72% normal skull development compared to pls3 MO: p = 0.1105. (C) Analysis of body axis form with exemplary pictures for categorization. Control fish show 98.44% normal body axis, which is significantly reduced to 24.32% in 8 mM pls3 MO-treated fish (p < 0.0001). This effect is rescued by co-injection of 300 pg human PLS3, ACTN1, ACTN4, and FSCN1 mRNA (66.28%, 52.87%, 58.47%, and 50.55% normal body axis, respectively, compared to pls3 MO: p < 0.0001). (D) Analysis of tail form with exemplary pictures for categorization. Control fish show 100% normal tail, which is significantly reduced to 52.43% in 0.8 mM pls3 MO-treated fish (p < 0.0001). This effect is rescued by co-injection of 300 pg human PLS3, ACTN1, and ACTN4 mRNA (86.05%, 65.52%, and 72.68% normal tail, respectively, compared to pls3 MO: p < 0.0001, p < 0.05, p < 0.001, and p < 0.001). Co-injection of FSCN1 mRNA only showed 31.87% normal tail compared to pls3 MO: p < 0.001 (for every experimental set-up, n > 50; scale bar = 100 ?m).
|
