
Fig. 1
- ID
- ZDB-FIG-240829-90
- Publication
- Confino et al., 2024 - A deleterious variant of INTS1 leads to disrupted sleep-wake cycles
- Other Figures
- All Figure Page
- Back to All Figure Page
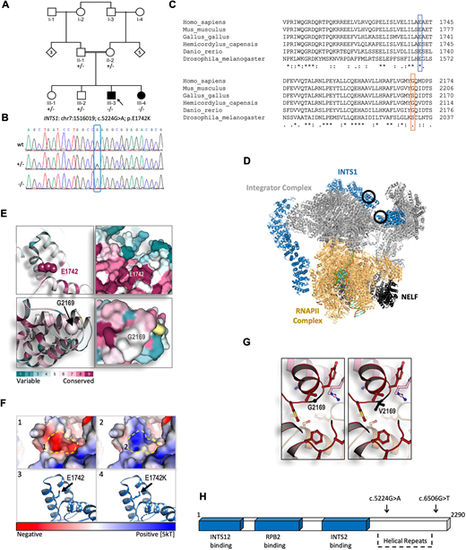
Exome sequencing and structural modelling of INTS1. (A) Pedigree of the family carrying the identified variant. Notice the parental consanguinity. (B) Sanger sequencing confirming the single nucleotide variant c.5224G>A (Gly?Ala) of INTS1 in this family. (C) Predicted amino acid sequences surrounding the altered amino acid residues in the indicated species, demonstrating high evolutionary conservation of human Glu1742 (E1742) and less evolutionary conservation of human Gly2169 (G2169) when compared with the species indicated. (D) Protein structure of the Integrator complex during transcriptional regulation based on Fianu et al. (2021); Protein Data Bank accession code 7PKS (https://www.rcsb.org/structure/7PKS). Main complexes shown are the integrator complex subunit 1 (INTS1, blue); the Integrator subunits 2, 4-9 and 11 (Integrator complex, gray); DNA-directed RNA polymerase subunits ?, E, F, RPB3, RPB7, RPB9, POLR2H, RPB10, RNAPII subunits D and K, RNAPII L2 domain-containing protein, and RPBI C-terminal domain peptide (RNAPII complex, gold); negative elongation factors A, B, C/D and E (NELF, black). Black circles indicate the position of the E1742K mutation (top circle) and the G2169V mutation (bottom circle). (E) Evolutionary structural conservation of human INTS1 variants, modelled using the Consurf algorithm (Ashkenazy et al., 2016). Regions surrounding E1742 and G2169 are shown as ribbon (left) and surface views (right). (F) Structural modelling of the E1742K substitution within the C-terminal region of INTS1. (1) Surface view of the conserved glutamic acid introduces a strong negatively charged pocket, indicated by the dashed line (in panels 1 and 2). (2) Surface view of the E1742K substitution. Exchanging the negatively charged E1742 to a positively charged K (Lys) alters the electrostatic dynamics from a strong negative to a strong positive one, predicting interference of surrounding structures. (3) Ribbon view showing the conserved glutamic acid residue. (4) Ribbon view showing the E1742K substitution within the most conceivable rotational isomer, i.e. rotamer, for K in this context. The electrostatic potential is represented by red-to-blue color spectrum, with potential values below ?5 kT/e shown in red and values above +5 kT/e in blue; (potential was calculated by solving the Poisson-Boltzmann equation at 310K). (G) Structural modelling of the G2169V substitution. This mutation was modelled in silico using Coot and REFMAC5 (see Material and Methods ?In silico analysis?). Ball and sticks structures of the WT (left) and mutated protein (right) are shown. (H) Schematic representation of INTS1 protein-interacting regions together with its C-terminal helical repeats tail. Sites of mutated amino acids are indicated by arrows above. |