Fig. 5
- ID
- ZDB-FIG-240604-11
- Publication
- De Pace et al., 2023 - Biallelic BORCS8 variants cause an infantile-onset neurodegenerative disorder with altered lysosome dynamics
- Other Figures
- All Figure Page
- Back to All Figure Page
|
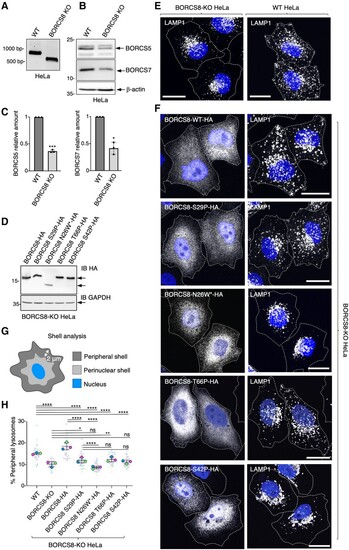
BORCS8 patient variants impair the lysosome-dispersal function of BORC. (A) Agarose gel electrophoresis and GelRed® staining of genomic BORCS8 PCR products yields 745-bp fragment for wild-type (WT) and 513-bp fragment for BORCS8-KO HeLa cells. (B) SDS-PAGE and immunoblot analysis of wild-type and BORCS8-KO HeLa cells using antibodies to endogenous BORCS5 and BORCS7. ?-Actin was used as a control. The positions of molecular mass markers (in kDa) are indicated on the left. (C) Quantification of BORCS5 and BORCS7 levels from three independent experiments such as that shown in B. Values are the mean ± standard deviation (SD). Statistical significance was calculated by Student?s t-test. *P < 0.05; ***P < 0.001. (D) BORCS8-KO HeLa cells were transiently transfected with the indicated HA-tagged BORCS8 constructs and cell extracts were immunoblotted (IB) for the HA epitope and GAPDH (loading control). The positions of molecular mass markers (in kDa) are indicated on the left. The positions of specific proteins are indicated by arrows. (E) Wild-type and BORCS8-KO HeLa cells were fixed, permeabilized and immunostained for the endogenous lysosomal protein LAMP1. Nuclei were labelled with DAPI (blue). Cell edges were outlined by staining of actin with fluorescent phalloidin (not shown) and indicated by dashed lines. Scale bars = 20 ?m. (F) BORCS8-KO cells were transiently transfected with the indicated HA-tagged constructs and immunostained for the HA epitope and endogenous LAMP1 as described for E. (G) Schematic representation of shell analysis. (H) Quantification by shell analysis of peripheral LAMP1 signal in HeLa cells from three experiments such as those shown in E and F. Data are presented as SuperPlots showing the individual data-points, the mean from each experiment, and the mean ± SD of the means. Statistical significance was calculated by one-way ANOVA followed by multiple comparisons using Tukey?s test. *P < 0.05; **P < 0.01; ****P < 0.0001; ns = not significant. |

