Fig. 5
- ID
- ZDB-FIG-240603-8
- Publication
- Rinné et al., 2024 - Popeye domain containing proteins modulate the voltage-gated cardiac sodium channel Nav1.5
- Other Figures
- All Figure Page
- Back to All Figure Page
|
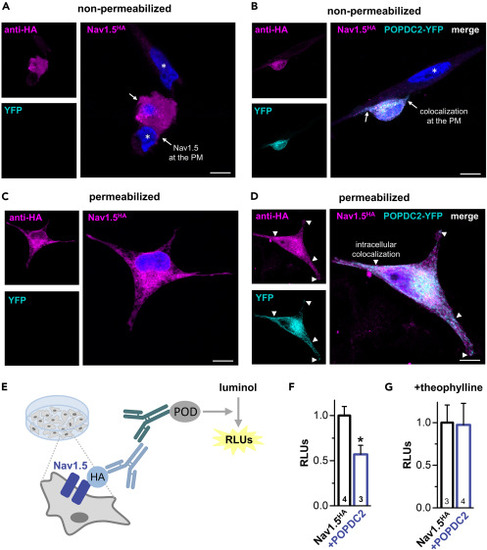
POPDC2 co-localizes with Nav1.5 at the plasma membrane and intracellular compartments and regulates the surface expression of Nav1.5 in a cAMP-dependent manner (A and C) HeLa cells were transfected exclusively with Nav1.5-HA or (B and D) in combination with POPDC2-YFP. 24 h after transfection the cells were fixed, non-permeabilized (A-B) or permeabilized (C-D) and immunostained with anti HA antibody and Alexa 647 conjugated secondary antibody. The cells were then analyzed by confocal microscopy. Nuclear counterstaining with Hoechst 33342 is depicted in blue and nuclei of non-transfected cells are indicated by asterisk. Arrows point to either (A) Nav1.5- or (B) Nav1.5- plus POPDC2-YFP-stained membrane protrusions; PM, plasma membrane. Arrowheads in (D) depict Nav1.5-positive intracellular structures co-labelled by POPDC2-YFP, which are also designated by arrows in the single fluorescence images shown on the left. Scale bars, 10 ?m. (E) Cartoon of the chemiluminescence-based ELISA-assay performed in HeLa cells transiently transfected with Nav1.5HA to quantify the changes in Nav1.5 surface expression by co-transfection with POPDC2. In fixed cells, the primary antibody detects extracellularly HA-tagged Nav1.5 channels (Nav1.5HA) at the surface membrane while the peroxidase-enzyme (POD) which is linked to the secondary antibody catalyzes the oxidation of a luminol-substrate which is accompanied by the emission of light. Subsequently, the light emission can be quantified as relative light units (RLUs) as a measure of the surface expression of the channel. (F) Chemiluminescence assay of extracellularly HA-tagged Nav1.5 to determine the relative changes in surface expression by co-expressed POPDC2. The number of biological replicates (N) is indicated in the bar graphs. Data are expressed as relative light units (RLUs). Data are presented as mean ± s.e.m. Significance was probed using a two-sided Student?s t-test. ?, p < 0.05. (G) Chemiluminescence assay of extracellularly HA-tagged Nav1.5 to determine the relative changes in surface expression by co-expressed POPDC2 in the presence of theophylline. The number of biological replicates (N) is indicated in the bar graphs. Data are expressed as relative light units (RLUs). Data are presented as mean ± s.e.m. |

