
Fig. 3
- ID
- ZDB-FIG-240603-6
- Publication
- Rinnť et al., 2024 - Popeye domain containing proteins modulate the voltage-gated cardiac sodium channel Nav1.5
- Other Figures
- All Figure Page
- Back to All Figure Page
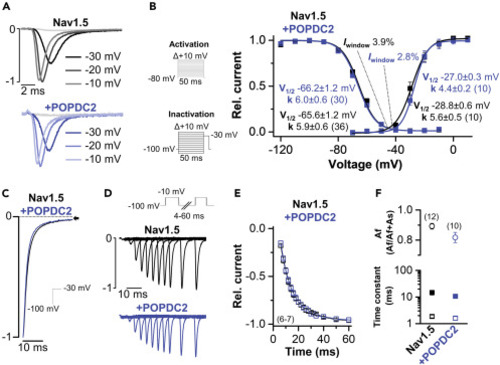
POPDC2 does not alter the current kinetics of Nav1.5 (A) Current traces of human Nav1.5 expressed alone or co-expressed with human POPDC2. Representative traces are depicted at ?30 mV, ?20 mV and ?10 mV. (B) Voltage-dependence of activation and inactivation curves fitted to a Boltzmann equation. The respective voltages of half-maximal activation (V1/2) together with the Boltzmann constants (k), as well as the window currents, are provided as inset. For the V1/2 of activation measurements, the currents were recorded with a P/N (N = 4) voltage-step protocol (holding potential ?80 mV) and voltage-steps of 50 ms ranging from ?70 to +80 mV in 10 mV increments (see inset activation protocol). For the V1/2 of inactivation measurements, the currents were recorded with a P/N (N = 4) voltage-step protocol (holding potential ?100 mV) and voltage-steps of 50 ms ranging from ?120 to ?10 mV in 10 mV increments with a final step to ?30 mV for 50 ms (see inset inactivation protocol). The number of technical replicates (n) is indicated in parentheses. Data are presented as mean Ī s.e.m. (C) Representative current traces of the kinetics of inactivation recorded with a single-step protocol from ?100 mV to ?30 mV for 65 ms (inset illustrates voltage protocol). (D) Representative recordings of the recovery from inactivation (inset illustrates voltage protocol). (E) Time-course of the recovery from inactivation recorded with a two-pulse protocol, first step to ?10 mV for 50 ms and the second test pulse stepped to ?10 mV with increasing interpulse intervals. The number of technical replicates (n) is indicated in parentheses. Data are presented as mean Ī s.e.m. (F) Time constants of the fast and slow component of the recovery from inactivation (lower panel) and the relative contribution of the fast and slow component (upper panel). Values were obtained by a bi-exponential fit from the data in (E). Oocytes were stored in a storage solution lacking theophylline. The number of technical replicates (n) is indicated in parentheses. Data are presented as mean Ī s.e.m. See also Figure S3. |