|
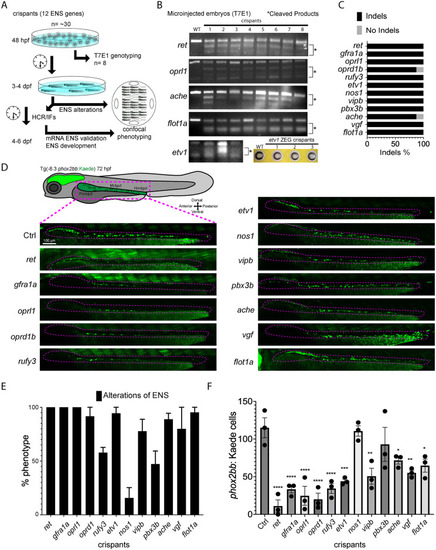
Candidate genes targeted in an F0 CRISPR screen display ENS phenotypic alterations. (A) At 48 hpf, eight crispant embryos from pools of around thirty embryos were used to validate CRISPR activity via T7E1, for each gene targeted. If the majority had indels, then subsets of the pool were grown at 3 to 4 dpf to phenotype their ENS. The phenotyping process combined crispants of different genes by using an agarose cast that enabled high-content semi-automated confocal imaging. An additional fraction of the crispants were analyzed at 4–6 dpf for additional HCR validation or for late phenotypic alterations. (B) Representative images of different T7E1 assays demonstrate indels of different embryos in the specific gene-targeted regions. etv1 gene was genotyped using ZEG. The asterisks denote the presence of cleaved products. (C) Percentage of embryos with CRISPR/Cas9 induced indels of different ENS genes (≥ 2 experiments). (D) Confocal images of Tg(-8.3phox2bb:Kaede) ENCCs/ENs for different crispants along the gut at 72 hpf. ENCCs/ENs of most crispants failed to localize distal hindgut (≥ 2 experiments). (E) Pools of the twelve ENS gene crispants showing the percentage of phenotypic alterations (≥ 3 experiments). (F) Number of fluorescent ENCCs and/or ENs along the gut from the different gene crispants (≥ 3 experiments with 3 biological replicates). Comparing the mean of the control with the mean of each gene, ANOVA P value ****: <0.0001, ***: 0.0004, **: <0.003, *: <0.05.
|