
FIGURE
Figure 2
- ID
- ZDB-FIG-240113-31
- Publication
- Sobah et al., 2023 - Contribution of Signal Transducer and Activator of Transcription 3 (STAT3) to Bone Development and Repair
- Other Figures
- All Figure Page
- Back to All Figure Page
Figure 2
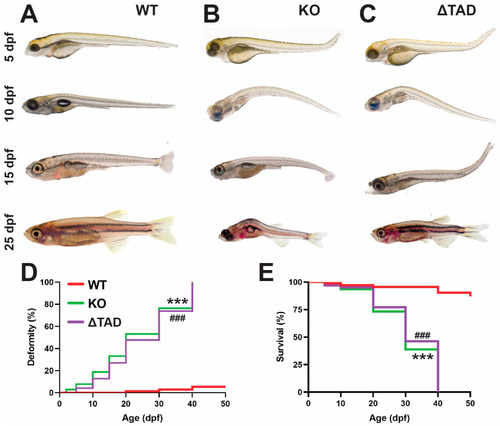
Deformity and mortality of Stat3 mutants. Representative images of Stat3 wildtype (WT: |
Expression Data
Expression Detail
Antibody Labeling
Phenotype Data
| Fish: | |
|---|---|
| Observed In: | |
| Stage Range: | Day 5 to Days 21-29 |
Phenotype Detail
Acknowledgments
This image is the copyrighted work of the attributed author or publisher, and
ZFIN has permission only to display this image to its users.
Additional permissions should be obtained from the applicable author or publisher of the image.
Full text @ Int. J. Mol. Sci.