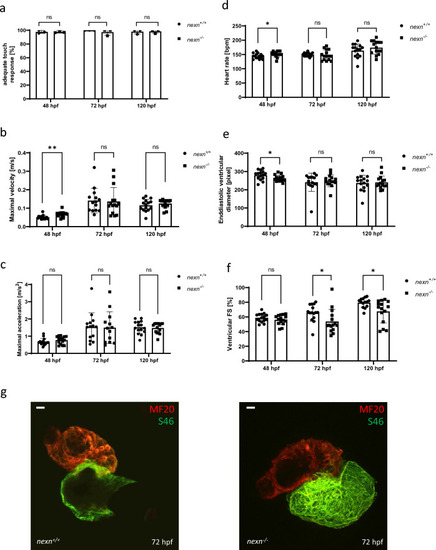
nexn knockout causes reduced cardiac function in zebrafish. (a) nexn+/+ and nexn−/− embryos do not show differences regarding responsiveness to mechanical stimuli at any developmental stage (N = 3, mean ± SD, p > 0.9999 for all using Mann–Whitney test). (b) nexn−/− embryos showing increased velocity at 48 hpf (N = 3, n = 15, mean ± SD, p = 0.0017 using two-tailed t-test) but not at later time points (N = 3, n = 14/15, mean ± SD, 72 hpf: p = 0.8709, 120 hpf: p = 0.3610 using two-tailed t-test). (c) Acceleration is at a similar level in nexn+/+ and nexn−/− embryos at 48, 72 and 120 hpf (N = 3, n = 14/15, mean ± SD, 48 hpf: p = 0.2121, 72 hpf: p = 0.9312, 120 hpf: p = 0.7324 using two-tailed t-test). (d) Heart rate was increased in nexn−/− embryos at 48 hpf (N = 3, n = 15, mean ± SD, p = 0.0404 using two-tailed t-test) but at a similar level as in nexn+/+ embryos at 72 and 120 hpf (N = 3, n = 15, mean ± SD, 72 hpf: p = 0.6927, p = 0.2300 using two-tailed t-test). (e) Whereas enddiastolic ventricular diameter was significantly decreased in nexn−/− embryos at 48 hpf (N = 3, n = 15, mean ± SD, p = 0.0350 using two-tailed t-test), it was not affected at 72 or 120 hpf (N = 3, n = 15, mean ± SD, 72 hpf: p = 0.6099, 120 hpf: p = 0.8075 using two-tailed t-test). (f) Analysis of ventricular fractional shortening does not show altered heart contractility in nexn−/− at 48 hpf (N = 3, n = 15, mean ± SD, p = 0.2315 using two-tailed t-test) but reduced contractility at 72 and 120 hpf (N = 3, n = 15, mean ± SD, 72 hpf: p = 0.0300, 120 hpf: p = 0.0141 using two-tailed t-test). (g) MF20/S46 staining shows properly differentiated ventricle and atrium in nexn−/− and nexn+/+ embryos at 72 hpf. Scale bar (20 µM) refers to both images. FS fractional shortening, ns not significant, *p < 0.05, **p < 0.01. Exact values (mean ± SD) are shown in Supplementary Table 1.
|