|
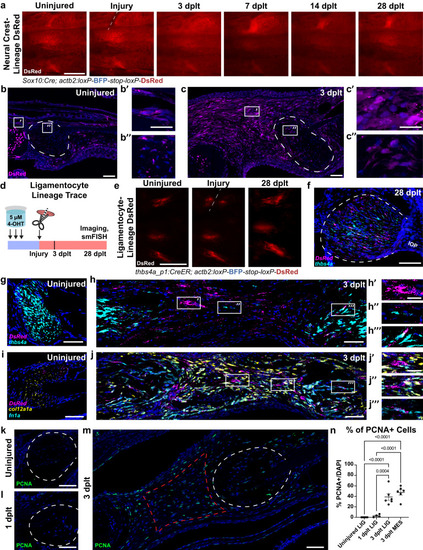
Lineages contributing to ligament regeneration following transection injury. a Lineage trace of DsRed-labeled cells using Sox10:Cre with actb2:loxP-BFP-STOP-loxP-DsRed. (b, c) DsRed immunofluorescence (magenta) in Sox10:Cre;actb2:loxP-BFP-STOP-loxP-DsRed from uninjured (b) and 3 dplt (c) (n = 4/time-point). Insets highlight NC-derived cells in periosteum (b’), uninjured ligament (b”), regenerative mesenchyme (c’), and injured ligament (c”). Ligament outlined in white dashed line. d Schematic of ligamentocyte lineage tracing. thbs4a_p1:CreER;actb2:loxP-BFP-STOP-loxP-DsRed fish were 4-OHT treated, screened for conversion, then imaged. e Repeated ventral live imaging of DsRed-labeled thbs4a-lineage before, immediately following, and 28 dplt (cut site at dashed white line) (n = 5/time point). DsRed (magenta) and thbs4a (cyan) smFISH in 28 dplt (f), uninjured (g) and 3 dplt (h) ligaments from thbs4a_p1:CreER;actb2:loxP-BFP-STOP-loxP-DsRed (n = 5/time point). Insets illustrate DsRed single-positive (h’), thbs4a single-positive (h”), and DsRed-thbs4a double-positive cells in the regenerative mesenchyme (h”’). DsRed (magenta), col12a1a (yellow), and fn1a (cyan) smFISH in uninjured (i) and 3 dplt (j) converted thbs4a_p1:CreER;actb2:loxP-BFP-STOP-loxP-DsRed fish (n = 5). Insets illustrate DsRed single-positive (j’) and fn1a-col12a1a double-positive regenerative mesenchyme (j”), and DsRed-fn1a double-positive cells in the ligament (j”’). PCNA immunofluorescence (green) in uninjured (k), 1 dplt (l), and 3 dplt (m). Ligament outlined in white dashed line, regenerative mesenchyme domain in red dashed line. n Quantification of percent PCNA+ nuclei in (k–m), showing significant increase in proliferation at 3 dplt (n = 4-6 per time point). Scale bars = 500 μm (a, e), 50 μm (b, c, g, h, I, j), 20 μm (b’, c’, h’, j’).
|