|
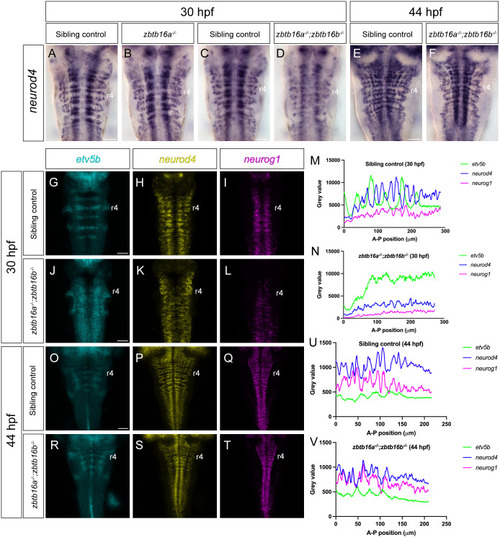
Spatial pattern of neurogenesis in Zbtb16 mutants. (A-F) Colorimetric ISH for neurod4 in 30 hpf sibling control (n=121) and zbtb16a−/− (n=7) embryos (A,B); 30 hpf sibling control (n=18) and zbtb16a−/−;zbtb16b−/− (n=8) embryos (C,D); 44 hpf sibling control (n=8) and zbtb16a−/−;zbtb16b−/− (n=8) embryos (E,F). (G-L,O-T) HCR for etv5b, neurod4 and neurog1 in 30 hpf sibling control (n=16) and zbtb16a−/−;zbtb16b−/− (n=11) embryos (G-L); 44 hpf sibling control (n=9) and zbtb16a−/−;zbtb16b−/− (n=12) embryos (O-T). Sum projections through confocal z-stack. (M,N,U,V) Profile plots of etv5b, neurod4 and neurog1 HCR signal across the hindbrain of representative sibling control (zbtb16a+/+;zbtb16b−/−) and zbtb16a−/−;zbtb16b−/− embryos; anterior to the left. Scale bars: 50 µm.
|