|
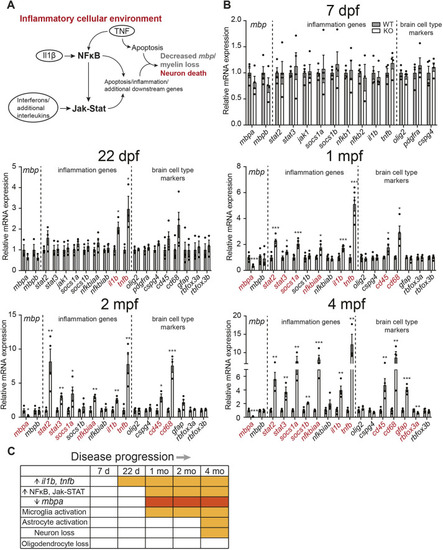
Neuroinflammatory response precedes mbpa loss in psap+63/+63 zebrafish. (A) Schematic of inflammation-driven disease progression in the psap KO model. (B) Relative expressions of representative markers for myelination, inflammation and major brain cell populations at 7 dpf, 22 dpf, 1 mpf (33 dpf), 2 mpf and 4 mpf. Representative data from two independent qRT-PCR datasets; n=3-5 WT and n=3-5 psap+63/+63 for each dataset. Data points for each dataset were normalized to the average of the WT samples in that set. Data show the mean±s.e.m. Two-tailed unpaired Student's t-test was used. *P<0.05; **P<0.01, ***P<0.001. (C) Table illustrating the onset of major cellular events in psap+63/+63 zebrafish relative to WT siblings, based on first appearance of statistically significant changes in the corresponding marker genes. Red boxes denote statistically significant time points for mbpa; orange boxes denote statistically significant time points for all additional pathway markers.
|