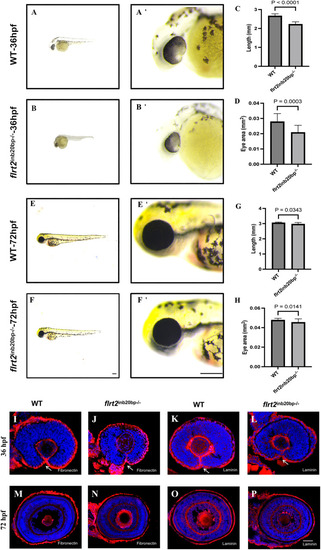
flrt2-KO leads to zebrafish slow development and reduces eye size. (A,B) Phenotypes of WT and flrt2−/− embryos at 36 hpf, with A′ and B′ are the magnified images of the heads from A and B, respectively. (C,D) Statistical analysis of body length and eye size in WT and flrt2−/− embryos at 36 hpf (n=17/each group); C: t=10.543, P<0.0001; D: t=4.098, P=0.0003. (E,F) Phenotypes of WT and flrt2−/− embryos at 72 hpf, with E′ and F′ showing the magnified images of the heads from E and F, respectively. Leica stereomicroscope M205 was used: M205FA 30×/161×; scaling (per pixel): 1.00 pixel×1.00 pixel; image size (pixel): 1392×1040. Scale bars: 200 µm. (G,H) Statistical analysis of body length and eye size in WT and flrt2−/− embryos at 72 hpf (n=20/each group); G: t=2.290, P=0.0343; H: t=2.575, P=0.0141. The solid bars represent the means±standard deviations. (I–P) At 36 hpf and 72 hpf, WT zebrafish were stained with (I,M) anti-fibronectin or (K,O) anti-laminin. At 36 hpf and 72 hpf, flrt2−/− zebrafish were stained with (G,N) anti-fibronectin or (L,P) anti-laminin (n=20/each group). Arrows point to the unfused OF. LSM 980 with Airyscan was used: objective: plan-apochromat 20×/0.8 M27; scaling (per pixel): 0.414 µm×0.414 µm; image size (pixel): 1024×1024; effective NA: 0.8. Scale bar: 50 µm.
|