FIGURE SUMMARY
Title

Loss of flrt2 gene leads to microphthalmia in zebrafish

Authors
Yang, S., Huang, L., Liang, H., Guo, J., Liu, L., Chen, S., Cao, M.
Source
Full text @ Biol. Open

Schematic diagram illustrating the primary structure of FLRT2 adapted fromFlintoff et al., 2014andLacy et al., 1999. The extracellular domain contains 10 Leucine Rich Repeat sequences flanked by N- and C- terminal cysteine-rich regions. The FNIII domain lies closer to the cell membrane. These proteins span the cell membrane once and have a short cytoplasmic tail. SS: signal sequence; NFR: cysteine-rich domains flanking N′ terminal ends of LRR domain; LRR: 10 leucine-rich repeats; CFR: cysteine-rich domains flanking C′ terminal ends of LRR domain; FN: fibronectin III domain; TM: transmembrane domain; IC: cytoplasmic tail.

flrt2 is expressed in developing zebrafish eyes. (A,D″) Lateral views of flrt2 mRNA whole-mount in situ hybridization of (A,A′) 24 hpf, (B,B′) 36 hpf, (C,C′) 48 hpf, and (D,D′) 72 hpf zebrafish embryos. (A″-D″) Dorsal views of flrt2 mRNA whole-mount in situ hybridization of (A″) 24 hpf, (B″) 36 hpf, (C″) 48 hpf, and (D″) 72 hpf zebrafish embryos. (E-H″) Embryos exposed to a sense riboprobe were used as a negative control. n=20/each group. Scale bar: 200 µm. Leica stereomicroscope M205 was used: objective: M205FA 30×/161×; scaling (per pixel): 1.00 pixel×1.00 pixel; image size (pixels): 1392×1040.

Generation of flrt2-KO zebrafish line by CRISPR/Cas9 genome editing. (A) Sequencing maps of WT, flrt2+/− mutants and flrt2−/− mutants. The sequences in the red frame represent the areas targeted by CRISPR/Cas9. Blue background indicates CGG base pairs in WT and heterozygous zebrafish. (B) Sequence alignment of the WT and flrt2-KO zebrafish line, including the 20-bp deletion in homozygotes. (C) Reduced expression of flrt2 mRNA in the brain of WT and flrt2−/− larvae (24 hpf) zebrafish analyzed by RT-qPCR (n=30/each group); t=23.58, P<0.0001. The solid bars represent the means±standard deviations. (D) Schematic diagram of FLRT2 protein translation. The yellow arrows indicate the process and direction of flrt2 mRNA translation into protein. Blue background means the position of the premature termination of protein translation. And the bottom indicates that the FLRT2 protein translation is forced to prematurely terminate the site.

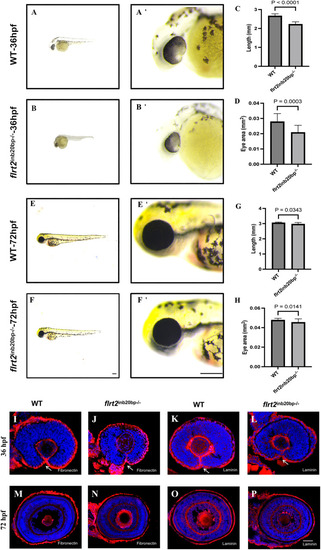
flrt2-KO leads to zebrafish slow development and reduces eye size. (A,B) Phenotypes of WT and flrt2−/− embryos at 36 hpf, with A′ and B′ are the magnified images of the heads from A and B, respectively. (C,D) Statistical analysis of body length and eye size in WT and flrt2−/− embryos at 36 hpf (n=17/each group); C: t=10.543, P<0.0001; D: t=4.098, P=0.0003. (E,F) Phenotypes of WT and flrt2−/− embryos at 72 hpf, with E′ and F′ showing the magnified images of the heads from E and F, respectively. Leica stereomicroscope M205 was used: M205FA 30×/161×; scaling (per pixel): 1.00 pixel×1.00 pixel; image size (pixel): 1392×1040. Scale bars: 200 µm. (G,H) Statistical analysis of body length and eye size in WT and flrt2−/− embryos at 72 hpf (n=20/each group); G: t=2.290, P=0.0343; H: t=2.575, P=0.0141. The solid bars represent the means±standard deviations. (I–P) At 36 hpf and 72 hpf, WT zebrafish were stained with (I,M) anti-fibronectin or (K,O) anti-laminin. At 36 hpf and 72 hpf, flrt2−/− zebrafish were stained with (G,N) anti-fibronectin or (L,P) anti-laminin (n=20/each group). Arrows point to the unfused OF. LSM 980 with Airyscan was used: objective: plan-apochromat 20×/0.8 M27; scaling (per pixel): 0.414 µm×0.414 µm; image size (pixel): 1024×1024; effective NA: 0.8. Scale bar: 50 µm.

Retinal progenitor cell proliferation was not affected by the flrt-KO. (A,B) Images of 36 hpf zebrafish eye sagittal sections stained with anti-BrdU antibody (red). (C) Quantification of BrdU+ cells/section in WT and flrt2-KO retinas at 36 hpf; t=1.977, P=0.0762. Scale bars: 50 µm (n=6/each group). (D,E) TUNEL staining (green) of 36 hpf zebrafish eye sagittal sections. (F) Quantification of TUNEL+ cells/section in WT and flrt2-KO retinas at 36 hpf; t=4.911, P<0.0001. Scale bars: 50 µm (n=15/each group). The solid bars represent the means±standard deviations. LSM 980 with Airyscan was used: objective: plan-apochromat 20×/0.8 M27; scaling (per pixel): 0.414 µm×0.414 µm; image size (pixel): 1024×1024; effective NA: 0.8.

Retinal cells fate determination in flrt2-KO zebrafish. Immunofluorescence staining with retinal neural markers: (A,E) co-labelling with anti-GFAP antibodies (for glial cells, magenta) and anti-α-PKC antibodies (for bipolar cells, green). (B,F) Co-labelling with anti-GS antibodies (for Müller cells, magenta) and anti-Recoverin antibodies (for photoreceptor cells, green). (C,G) Co-labelling with anti-Rho 1D4 antibodies (for long double-cone outer segments, magenta) and anti-Pax6 antibodies (for ganglion and amacrine precursor cells, green). (D,H) Labelling with anti-Zn5 antibodies (for mature RGCs, magenta) in WT and flrt2-KO larvae retinas. Blue, DAPI staining of the nuclei. n=20/each group. Scale bar: 50 μm. ISM 710 was used: objective: LD plan-neofluar 20×/0.4 Korr M27; scaling (per pixel): 0.497 µm×0.497 µm; image size (pixel): 1388×1040; effective NA: 0.4; depth of focus: 8.02 µm.

flrt2-KO zebrafish showed normal optic nerve projection. RGC axon projection in zebrafish at 6 dpf. Above: RGC axon projection in WT larvae, below: RGC axon projection in flrt2−/− mutant larvae. Retinotopic anterograde RGC axon labeling using DiI and DiO. n=20/each group. Scale bar: 200 μm. (A-G) LSM 980 with Airyscan was used: objective: plan-apochromat 10×/0.45 M27; scaling (per pixel): 0.829 µm×0.829 µm×8.790 µm; image size (pixel): 1024×1024; effective NA: 0.45; depth of focus: 5.43 µm. (C′,G′) LSM 980 with Airyscan was used: objective: plan-apochromat 20×/0.8 M27; scaling (per pixel): 0.414 µm×0.414 µm×3.760 µm; image size (pixel): 1024×1024; effective NA: 0.8; depth of focus: 1.72 µm.

Gene expression changes in flrt2-KO eyes. (A) Volcano plots showing the gene expression differences between flrt2-KO and WT retinas at 36 hpf identified ueing RNA-seq. (B) RNA-seq heatmap showing the DEGs associated with cell adhesion, cell apoptosis, retinal development, and transcriptional regulatory activity in the flrt2-KO and WT eyes (n=40 per group). The heatmap shows upregulated and downregulated genes in red and blue, respectively. The color key represents the normalized data from RNA-seq. (C) Gene ontology enrichment analysis like biological process (BP), cellular component (CC) and molecular functions (MF). (D) Functional pathway enrichment analysis. The DEGs were involved in various KEGG biological pathways.

Acknowledgments
This image is the copyrighted work of the attributed author or publisher, and ZFIN has permission only to display this image to its users. Additional permissions should be obtained from the applicable author or publisher of the image. Full text @ Biol. Open