
Fig. 7
- ID
- ZDB-FIG-230509-27
- Publication
- Nikolaou et al., 2022 - Cytoplasmic pool of U1 spliceosome protein SNRNP70 shapes the axonal transcriptome and regulates motor connectivity
- Other Figures
- All Figure Page
- Back to All Figure Page
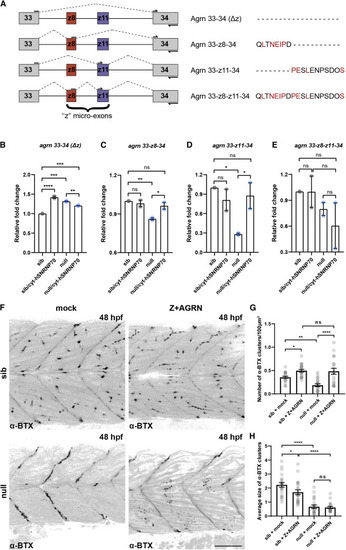
Figure 7. Cytoplasmic SNRNP70 regulates the abundance of Z+AGRN splice variants (A) Agrin Z+ (Z+AGRN) isoforms identified by RT-PCR are shown schematically, with conserved residues between humans and zebrafish shown in red. Arrows depict the position of primers used for the qPCR analysis in (B)?(E). (B?E) RT-qPCR analysis in sibling and null animals as well as following ubiquitous overexpression of cytosolic hSNRNP70-eGFP using Tg(ubi:ERT2-Gal4; UAS:hSNRNP70?NLS3xNES-eGFP) embryos at 28 hpf. Primers were designed to specifically amplify the expression of non-z+agrn (agrn 33?34 (?z)) isoforms (B), as well as the three z+agrn isoforms: 33-z8-34 (C), 33-z11-34 (D), and 33-z8-z11-34 (E). The graphs show mean values � SEM for fold change in expression in relation to control animals (sib). ????p < 0.0001; ???p < 0.001; ??p < 0.01; ?p < 0.05; ns, not significant, one-way ANOVA, datapoints represent two independent biological replicates per group. (F) Representative images depicting a superficial layer of the trunk myotomes showing the distribution of ?-BTX-labeled AChR clusters in mock- and Z+AGRN-treated sibling and null animals at 48 hpf. Images are lateral views with anterior to the left. Scale bars, 50 ?m. (G) Quantification of the number of ?-BTX clusters in the four groups. The graph shows mean values � SEM. ????p < 0.0001; ??p < 0.01; ?p < 0.05; ns, not significant, one-way ANOVA, n = 21 animals per group in two independent experiments. (H) Graph showing mean values � SEM of the average size of ?-BTX clusters in the four groups. ????p < 0.0001; ?p < 0.05; ns, not significant, one-way ANOVA, n = 21 animals per group in two independent experiments. |