
Figure 4
- ID
- ZDB-FIG-230427-18
- Publication
- McQuate et al., 2023 - Activity regulates a cell type-specific mitochondrial phenotype in zebrafish lateral line hair cells
- Other Figures
- All Figure Page
- Back to All Figure Page
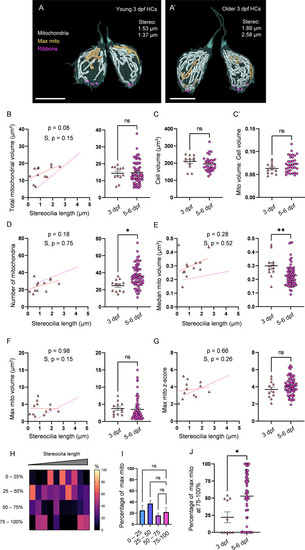
(A) Representative young HCs from a 3 dpf neuromasts (NM) (NM6, Figure 4?source data 2). Max mito shown in gold. Synaptic ribbons shown in purple. Scale bar = 8 �m. (A?) Representative older HCs from a 3 dpf NM (NM6, Figure 4?source data 2). Scale bar = 6 �m. (B) Comparison of total mitochondrial volume development (left) and average (right) between 3 dpf and 5?6 dpf HCs. On average (in �m3): 3 dpf: 14.4 � 1.2; 5?6 dpf: 14.8 � 0.8. Kolmogorov?Smirnov test, p=0.49. (C) Total HC volume for 3 dpf and 5?6 dpf HCs. (In �m3) 3 dpf: 210.1 � 11.3; 5?6 dpf: 195.6 � 7.2. Kolmogorov?Smirnov test, p=0.2. (C?) Ratio of total mitochondrial volume to HC volume. 3 dpf: 0.06 � 0.003; 5?6 dpf: 0.07 � 0.003. Kolmogorov?Smirnov test, p=0.41. (D) Comparison of the number of HC mitochondria over development (left) and on average (right) in 3 dpf and 5?6 dpf HCs. On average: 3 dpf: 25.0 � 2; 5?6 dpf: 36.1 � 1.6. Kolmogorov?Smirnov test, p=0.022. (E) Comparison of the median mitochondrial volume over development (left) and on average (right). On average (in �m3): 3 dpf: 0.3 � 0.02; 5?6 dpf: 0.2 � 0.01. Kolmogorov?Smirnov test, p=0.005. (F) Comparison of the max mito volume over development (left) and on average (right). On average (in �m3): 3 dpf: 3.8 � 0.5; 5?6 dpf: 3.5 � 0.4. Kolmogorov?Smirnov test, p=0.32. (G) Comparison of the max mito z-score in 3 dpf and 5?6 dpf HCs over development (left) and on average (right). On average: 3 dpf: 3.7 � 0.3; 5?6 dpf: 4.1 � 0.1. Standard unpaired t-test, p=0.21. (B?G) Solid line represents the standard linear regression for 3 dpf HCs. Dashed line represents standard regression for the 5?6 dpf HCs dataset as in Figure 2. Significance of the 3 dpf regression and difference with 5?6 dpf regression slope (S) are indicated. (H) The percentage of the max mito located within each quadrant of 3 dpf HCs represented as a heat map. Two HCs in the 3 dpf dataset lacked ribbons to provide a consistent HC lowest point and were not included in this analysis. (I) Summary of the heat map data shown in (H). Most apical quadrant (0?25%): 24.9 � 8.9%; 25?50%: 37.2 � 5.7%; 50?75%: 16.0 � 4.2%; Most basal quadrant (75?100%): 22.0 � 7.9%. Kruskal?Wallis test with Dunn?s multiple comparisons, nonsignificant. (J) Percentage of max mito located within the most basal quadrant for individual HCs. 3 dpf: 22.0 � 7.9%, 5?6 dpf: 52.8 � 4.4%. Kolmogorov?Smirnov test, p=0.017. Same cells as in (H, I). (B, D?G) 3 dpf data: n = 12 HCs, 2 NMs, 2 fish. 5?6 dpf data: n = 65 HCs, 5 NMs, 3 fish. (C, C?) 3 dpf data: n = 12 HCs, 2 NMs, 2 fish. 5?6 dpf data: n = 35 HCs, 3 NMs, 3 fish. (H?J) 3 dpf data: n = 10 HCs, 2 NMs, 2 fish. 5?6 dpf data: n = 65 HCs, 5 NMs, 3 fish. Where applicable, data are presented as the mean � SEM.
|