
Figure 3
- ID
- ZDB-FIG-230427-16
- Publication
- McQuate et al., 2023 - Activity regulates a cell type-specific mitochondrial phenotype in zebrafish lateral line hair cells
- Other Figures
- All Figure Page
- Back to All Figure Page
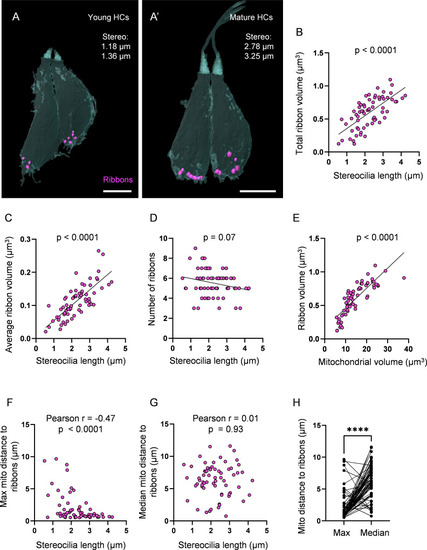
(A) Two representative young hair cells (HCs) from a 6 days post fertilization (dpf) neuromasts (NM) (NM4, Figure 3?source data 2) with synaptic ribbons shown in purple. Scale bar = 4.5 �m. (A?) Two representative mature HCs from a 6 dpf NM (NM4, Figure 3?source data 2). Scale bar = 4 �m. (B) Relationship between HC stereocilia length and the total ribbon volume. (C) Relationship between HC stereocilia length and the average ribbon volume. (D) Relationship between HC stereocilia length and the number of ribbons. (E) Relationship between HC total mitochondrial volume and HC ribbon volume. Black line = standard linear regression, with significance as indicated. (F) Relationship between HC stereocilia length and the average minimum distance between each ribbon and the max mito. (G) Relationship between HC stereocilia length and the average minimum distance between each ribbon and the median mito. (H) Average minimum distance between each ribbon and the HC max or median mito. (In �m) Max mito: 1.9 � 0.3; median mito: 6.3 � 0.3. Mann?Whitney test, ****p<0.0001. HC: n = 65, 5 NMs, 3 fish, 5?6 dpf.
|