
Fig. 4
- ID
- ZDB-FIG-230420-56
- Publication
- Yabe et al., 2023 - Ripply suppresses Tbx6 to induce dynamic-to-static conversion in somite segmentation
- Other Figures
- All Figure Page
- Back to All Figure Page
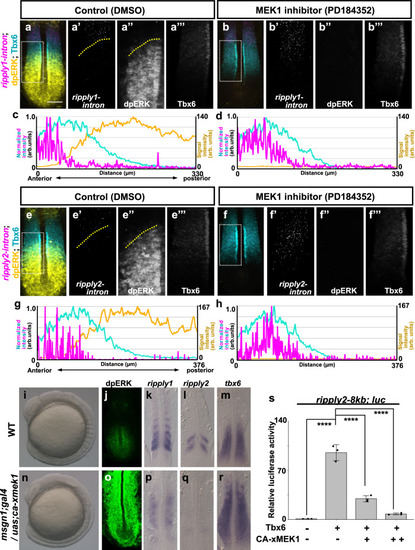
a–h Effect of ERK inhibition on expression of ripply1 (a–d) and ripply2 (e–h). Embryos were fixed at the 8-somite stage after 15 min treatment with 0.01% DMSO (a; n = 4, e; n = 5) or 10 µM PD184352 (b; n = 5, f; n = 5). The area of ripply transcription was represented by FISH using an intron probe (magenta) with co-staining of Tbx6 protein (cyan) and dpERK (yellow) by IHC. Magnified images of individual channels surrounded by white dotted squares are shown in the right panel. Yellow dotted lines indicate the anterior end of the dpERK signal gradient in the control embryo. Quantified signal intensity of (a, b, e, f) was plotted in (c, d, g, h) with anterior toward the left. Scale bar indicates 100 µm. i–r Effects of ERK over-activation on somitogenesis and ripply1 and ripply2 expression. Live phenotype of control WT (i) and msgn1;gal4/uas;ca-xmek1 (n)embryo at the 8-somite stage. WT (j–m) and msgn1;gal4/uas;ca-xmek1 (o–r) embryos were fixed at the 8-somite stage and stained dpERK (j; n = 3, o; n = 3) with IHC or ripply1 (k; n = 8, p; n = 8), ripply2 (l; n = 10, q; n = 8) and tbx6 (m; n = 8, r; n = 7) mRNA by WISH. Embryos were mounted after yolk removal with heads toward the upper side. s Reporter assay showing effects of ERK over-activation on activity of the ripply2 promoter using HEK293T cells. Crosses under each bar indicate amounts of plasmids used for transfection. The average of normalized firefly luciferase activity with pCS2+ (mock) alone was set at 1. Error bars represent standard deviations (n = 3 in each experiment). Differences of relative luciferase activity were statistically evaluated using one-way ANOVA followed by the Tukey–Kramer test. ****p < 0.0001. |