
FIGURE
Figure 2
- ID
- ZDB-FIG-230406-2
- Publication
- Quelle-Regaldie et al., 2023 - Severe neurometabolic phenotype in npc1-/- zebrafish with a C-terminal mutation
- Other Figures
- All Figure Page
- Back to All Figure Page
Figure 2
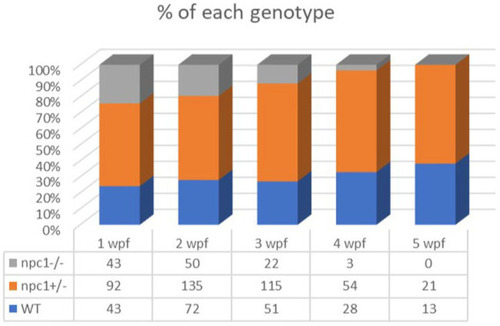
Representation of the percentage of surviving individuals per genotype from 1 to 5 wpf, showing a significant decrease in survival rate of npc1?/? larvae from 2 wpf. |
Expression Data
Expression Detail
Antibody Labeling
Phenotype Data
| Fish: | |
|---|---|
| Observed In: | |
| Stage Range: | Days 14-20 to Days 30-44 |
Phenotype Detail
Acknowledgments
This image is the copyrighted work of the attributed author or publisher, and
ZFIN has permission only to display this image to its users.
Additional permissions should be obtained from the applicable author or publisher of the image.
Full text @ Front. Mol. Neurosci.