
FIGURE
Figure 13
- ID
- ZDB-FIG-230406-13
- Publication
- Quelle-Regaldie et al., 2023 - Severe neurometabolic phenotype in npc1-/- zebrafish with a C-terminal mutation
- Other Figures
- All Figure Page
- Back to All Figure Page
Figure 13
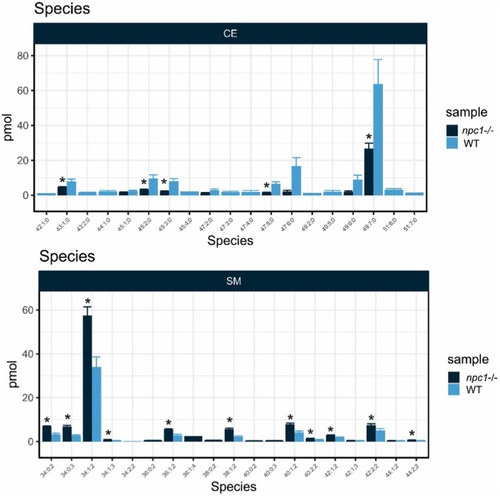
Lipid analysis showed reduction in most species of Cholesteryl Esters (CE) and increase of most species of Sphingomyelin (SM) in npc1?56/?56. Statistically significant data in the graphs is indicated with a *. |
Expression Data
Expression Detail
Antibody Labeling
Phenotype Data
| Fish: | |
|---|---|
| Observed In: | |
| Stage: | Days 14-20 |
Phenotype Detail
Acknowledgments
This image is the copyrighted work of the attributed author or publisher, and
ZFIN has permission only to display this image to its users.
Additional permissions should be obtained from the applicable author or publisher of the image.
Full text @ Front. Mol. Neurosci.