
Fig. 5
- ID
- ZDB-FIG-230302-18
- Publication
- Kamstra et al., 2022 - Leptin regulates glucose homeostasis via the canonical Wnt pathway in the zebrafish
- Other Figures
- All Figure Page
- Back to All Figure Page
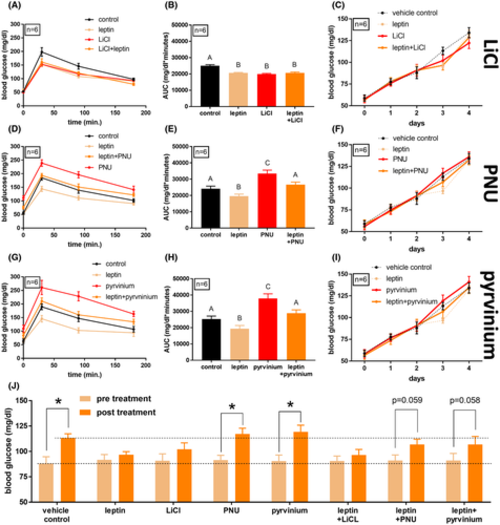
Glucose tolerance in wild-type zebrafish following Wnt pathway manipulation and leptin treatment. (A) Glucose tolerance of adult wild-type male zebrafish (n = 6). Fish were treated 10 ?M LiCl (3 h before glucose injection), 0.6 g/L of recombinant mouse leptin dissolved in Cortland salt solution (1 h before glucose injection), vehicle only, or a combination of LiCl and leptin. Following 0.5 mg/g glucose injection, blood samples were taken at 30, 90, and 180 min post-injection. (B) Area under the curve of (A). A?B = p < .05, one-way ANOVA. (C) Blood glucose values of adult wild-type male zebrafish (n = 6) over the course of a 4-day immersion in a 1% glucose solution. On the third day, fish were exposed to 10 ?M LiCl for 3 h before daily blood sampling. One hour before blood sampling, fish were injected intraperitoneally with 0.6 r/L of recombinant mouse leptin dissolved in Cortland salt solution, or with vehicle only. (D) Glucose tolerance of adult wild-type male zebrafish (n = 6). Fish were treated 10 ?M PNU74654 (3 h before glucose injection), 0.6 g/L of recombinant mouse leptin dissolved in Cortland salt solution (1 h before glucose injection), vehicle only, or a combination of PNU74654 and leptin. (E) Area under the curve of (D). A?B and A?C = p < .05, one-way ANOVA. (F) Blood glucose values of adult wild-type male zebrafish (n = 6) over the course of a 4-day immersion in a 1% glucose solution with exposure to 10 ?M PNU74654. (G) Glucose tolerance of adult wild-type male zebrafish (n = 6). Fish were treated with 10 ?M pyrvinium pamoate (3 h before glucose injection), 0.6 g/L of recombinant mouse leptin dissolved in Cortland salt solution (1 h before glucose injection), vehicle only, or a combination of pyrvinium pamoate and leptin. (H) Area under the curve of (G). A?B and A?C = p < .05, one-way ANOVA. (I) Blood glucose values of adult wild-type male zebrafish (n = 6) over the course of a 4-day immersion in a 1% glucose solution with exposure to 10 ?M pyrvinium pamoate. (J) Comparison of blood glucose levels in (C), (F), and (I), pre-treatment (day 2), and post-treatment (day 3). *p < .05, repeated-measures ANOVA |