
Fig. 2
- ID
- ZDB-FIG-230217-189
- Publication
- Guo et al., 2023 - Dynamic network biomarker identifies cdkn1a-mediated bone mineralization in the triggering phase of osteoporosis
- Other Figures
- All Figure Page
- Back to All Figure Page
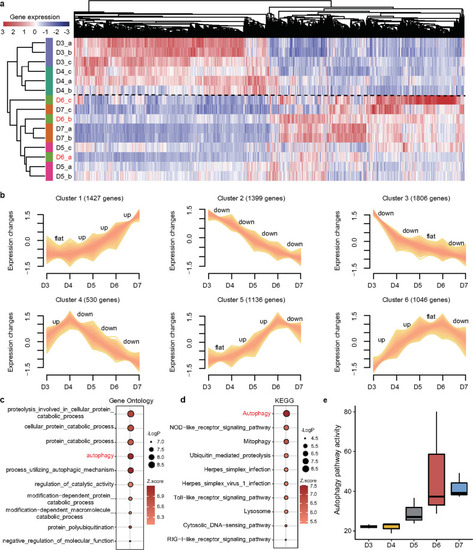
Dynamic changes in gene expression during the progression of osteoporosis.
a The heatmap shows unsupervised hierarchical clustering analysis based on differentially expressed genes (DEGs) among the five groups. The zebrafish on D6 after the addition of DEX were not concentrated but scattered, suggesting that the zebrafish were in a special and different state from other time points. b The series of graphs show the dynamic changed patterns in DEGs from D3 to D7 by Mfuzz. c, d Functional enrichment of the DEGs was summarized using (c) annotated Gene Ontology (GO) terms and (d) Kyoto Encyclopedia of Genes and Genomes (KEGG) pathways. e Quantitative assessment of the activity of autophagy in the DEX-induced osteoporosis zebrafish. |