Fig. 4
- ID
- ZDB-FIG-230118-37
- Publication
- Casteels et al., 2021 - An inhibitor-mediated beta cell dedifferentiation model reveals distinct roles for FoxO1 in glucagon repression and insulin maturation
- Other Figures
- All Figure Page
- Back to All Figure Page
|
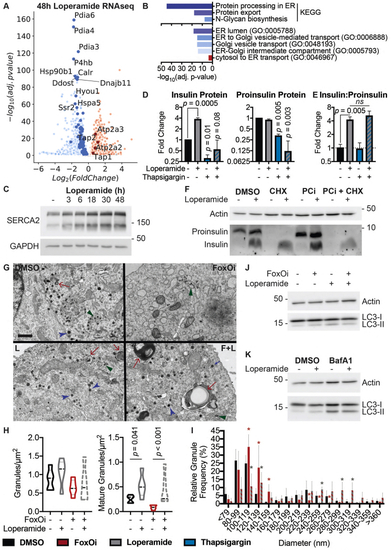
Loperamide alters ER proteome, rescuing FoxOi-induced arrest in insulin granule maturation and promotes autophagy.A. Volcano plot of gene expression changes upon 48h loperamide treatment, as measured by RNAseq. B. Overview of top enrichment terms for genes both significantly altered by loperamide relative to control and significantly rescued when co-treated with FoxOi relative to FoxOi. Volcano plot highlights the top KEGG term (protein processing in ER) in blue and GO:0046967 in red. C. Western blot showing increase in SERCA2 protein upon loperamide treatment in Min6 cells. D. Total intracellular insulin and proinsulin protein levels in Min6 cells treated with loperamide and 100 nM thapsigargin for 24h, as quantified by ELISA. E. Ratio of mature insulin to proinsulin protein. F. Western blot of proinsulin and insulin protein levels following 48h treatment of Min6 cells with loperamide +/? 200 ?g/mL cycloheximide (CHX) or 10 ?M prohormone convertase inhibitor (PCi) for the final 24h. G. Representative electron microscopy images of Min6 cells treated with FoxOi or loperamide. L = Loperamide; F + L = FoxOi + Loperamide. Green arrows pointing to immature secretory granules. Red arrows highlighting (autophago-)lysosomes. Blue arrows indicate mature insulin secretory granules. Scale bar = 1 ?m. H. Quantification of insulin granule density in electron microscopy images. Total number of granules per ?m2 (right) and number of mature (>160 ?m in diameter) granules per ?m2. N = 5 cells per treatment condition. I. Histogram of insulin granule size distribution upon FoxOi/loperamide treatment. DMSO = black; FoxOi = red; FoxOi + Loperamide = red/gray stripes. N = 5 cells per treatment condition. J. Levels of LC3B in Min6 cells treated with FoxOi and loperamide for 48h. K. Levels of LC3B in Min6 cells treated with loperamide for 48h +/? 200 nM bafilomycin A1 for the final 2h. |

