Fig. 3
- ID
- ZDB-FIG-230118-36
- Publication
- Casteels et al., 2021 - An inhibitor-mediated beta cell dedifferentiation model reveals distinct roles for FoxO1 in glucagon repression and insulin maturation
- Other Figures
- All Figure Page
- Back to All Figure Page
|
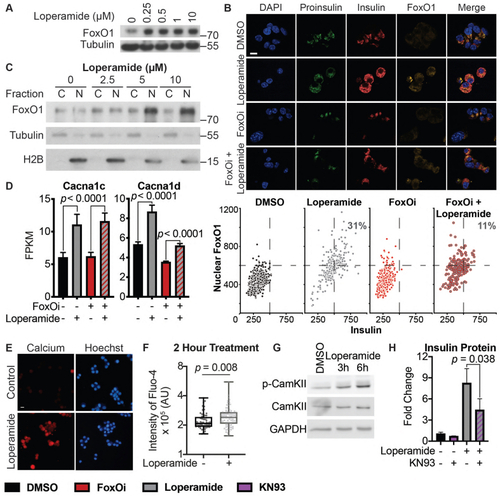
Loperamide increases FoxO1 expression and nuclear localization promoting changes in calcium signaling.A. Western blot showing an increase of FoxO1 protein with loperamide treatment in Min6 cells. B. Top: Representative immunofluorescence images of Min6 cells treated with loperamide and FoxOi for 48h. Scale bar = 10 ?m. Bottom: Quantification of insulin and nuclear FoxO1 intensities at the single cell level. C. Western blot of FoxO1 protein expression in the cytoplasm vs. nucleus of Min6 cells following different doses of loperamide treatment. D. mRNA levels of L-type voltage-gated calcium channels Cacna1c and Cacna1d in Min6 cells upon 48h loperamide and FoxOi treatment, as measured by RNAseq. E. Fura-2 staining in Min6 cells pretreated with loperamide for 18h. F. Quantification of Fluo-4 staining at the single cell level in Min6 cells treated with loperamide for 2h. G. Western blot highlighting an increase in p-CamKII relative to total CamKII protein levels in Min6 cells when treated with loperamide for the stated hours. H. Total mature insulin protein levels in Min6 cells treated with loperamide and 1 ?M KN-93 for 24h. |

