
Figure 5.
- ID
- ZDB-FIG-221211-313
- Publication
- Nelson et al., 2022 - The developmental progression of eight opsin spectral signals recorded from the zebrafish retinal cone layer is altered by the timing and cell type expression of thyroxin receptor β2 (trβ2) gain-of-function transgenes
- Other Figures
- All Figure Page
- Back to All Figure Page
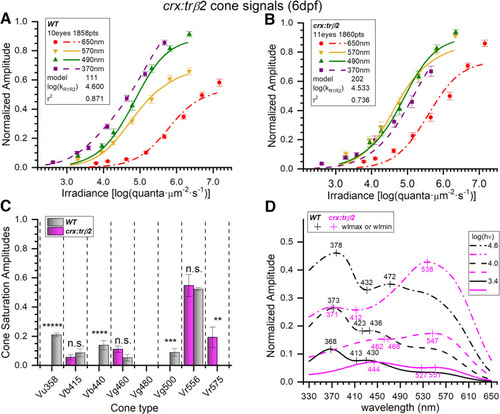
Spectral models of cumulative data from 6-dpf embryonic crx:mYFP-2A-tr?2 and wild-type eyes. A, WT irradiance-response datapoints, SEs, and optimal model (#111) curves as fit to 1858 spectral response amplitudes combined from 28 normalized datasets taken from 10 eyes (Fig. 1A, Eq. 1 algorithm); 370 nm, n = 23?28; 490 nm, n = 27?28; 570 nm; n = 23?28; 650 nm, n = 23?55. B, crx:tr?2 irradiance-response datapoints and optimal model (#202) curves fit to 1860 spectral points combined from 29 datasets taken from 11 eyes. Individual points: 370 nm, n = 22?28; 490 nm, n = 23?28; 570 nm, n = 27?28; 650 nm, n = 24?55. The crx:tr?2 transgene moves curves and points along the irradiance axis as compared with WT. C, In WT, six cone opsin types (gray bars) were detected by the optimal model. In crx:tr?2, four cone opsin signals were detected (magenta bars). Cone saturation amplitudes [Vmi values (Eq. 1; Fig. 2A) � SE] are fractions of dataset maximal amplitudes. Asterisks denote significance of differences between WT and crx:tr?2 (one-sample or two-sample t tests; n.s., not significant; GraphPad Prism convention). Vu358 (UV, one-sample test): t(1822) = 17.8, p = 1.2 � 10?65; Vb415 (B1): t(3647) = 0.958, p = 0.338; Vb440 (B2): t(1822) = 4.27, p = 2.0 � 10?5; Vg460 (G1): t(3647) = 1.87, p =0.062; Vg500 (G4, one-sample test): t(1822) = 3.33, p = 8.8 � 10?4; Vr556 (R2): t(3647) = 0.318, p = 0.751; Vr575 (R1): t(1825) = 2.72, p = 0.0067. D, Spectral peaks shift to longer wavelengths for crx:tr?2 (magenta) as compared with WT (black). Spectral curves are the modeled amplitudes that would be evoked by three different irradiances of constant quantal stimulation across the spectrum [3.4, 4.0, and 4.6 log(quanta�?m?2�s?1)]. Spectral shapes differ with stimulus brightness. A, B, The log(kR1R2) values are modeled R1-cone and R2-cone semi-saturation irradiances in log(quanta�?m?2�s?1). A?D, 20 mm aspartate medium. |