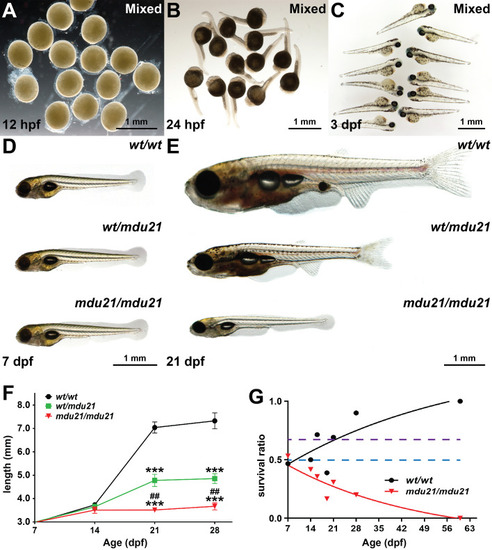
Impact of bcl6aa ablation on global development. (A?E). Light microscopy of representative images of mixed progeny (Mixed) derived from bcl6aawt/mdu21 in-crossing at 12 hpf (A), 24 hpf (B) and 3 dpf (C) or of individually genotyped bcl6aawt/wt (wt/wt), bcl6aawt/mdu21 (wt/mdu21) and bcl6aamdu21/mdu21 (mdu21/mdu21) embryos at 7 dpf (D) and 21 dpf (E), with 0.5 mm scale bars indicated. (F). Body length of individually genotyped bcl6aawt/wt (wt/wt), bcl6aawt/mdu21 (wt/mdu21) and bcl6aamdu21/mdu21 (mdu21/mdu21) individuals at the indicated time-points. Shown is the mean ± SEM, with statistical significance relative to wt/wt (***p<0.001 and wt/mdu21 (##p<0.01), (n>25). (G). Relative survival of bcl6aawt/wt (wt/wt) and bcl6aamdu21/mdu21 (mdu21/mdu21) individuals expressed as a ratio relative to bcl6aawt/mdu21 individuals from n>60 genotypes at each time point. The dotted lines show the expected Mendelian ratio for both wt/wt and mdu21/mdu21 individuals if all genotypes showed equivalent survival (blue) or for wt/wt individuals if they showed equivalent survival with wt/mdu21 in the absence of mdu21/mdu21 individuals (purple).
|

