FIGURE

Figure 7

ID
ZDB-FIG-221031-45
Publication
Gao et al., 2022 - Unraveling Differential Transcriptomes and Cell Types in Zebrafish Larvae Intestine and Liver
Other Figures
All Figure Page
Back to All Figure Page
Figure 7

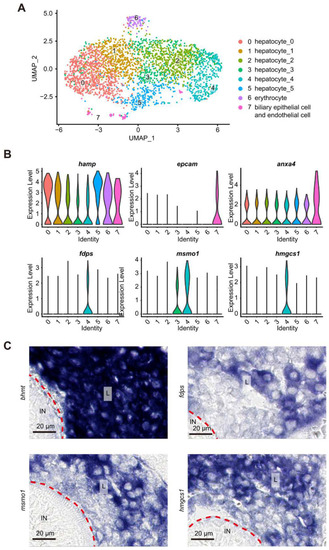
scRNA-seq analysis identified 8 cell clusters in the WT liver at 5 dpf. (A) Visualization of integrated unsupervised clustering of cells in the UMAP plot of the sequenced 3045 cells from the WT liver. (B) Violin graph showing the expression of hamp in all cell types, of faps and hmgcs1 in cluster 4, of msmo1 in both cluster 3 and 4 cells and of epcam in cluster 7 (cholangiocytes). (C) Sections of embryos after WISH using the probes for detecting the transcripts of bhmt (pan-hepatocyte marker), faps, hmgcs1 and msmo1. Note that bhmt was expressed abundantly in the liver bud, whereas faps, hmgcs1 and msmo1 were expressed only in a proportion of cells in the liver bud. A red dashed line separates the liver region (L) and intestinal lumen (IN).

Expression Data

Expression Detail
Antibody Labeling
Phenotype Data

Phenotype Detail
Acknowledgments
This image is the copyrighted work of the attributed author or publisher, and ZFIN has permission only to display this image to its users. Additional permissions should be obtained from the applicable author or publisher of the image. Full text @ Cells