
FIGURE
Fig. 3
- ID
- ZDB-FIG-220923-30
- Publication
- Duan et al., 2022 - Life Cycle Exposure to Cyhalofop-Butyl Induced Reproductive Toxicity in Zebrafish
- Other Figures
- All Figure Page
- Back to All Figure Page
Fig. 3
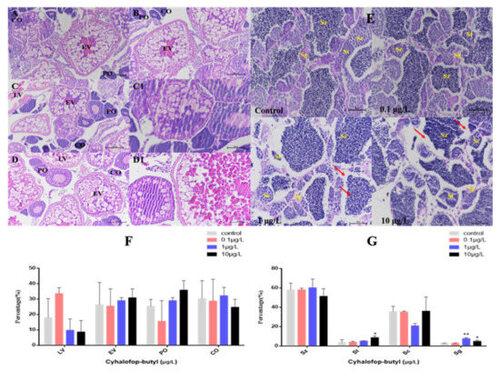
Figure 3. Histological observation of the gonads of zebrafish exposed to CyB for 150 d. Females: (A) control; (B) 0.1 µg/L; (C,C1) 1 µg/L; (D,D1) 10 µg/L. The oocytes in the ovaries included perinucleolar oocytes (PO), cortical alveolar oocytes (CO), early vitellogenic oocytes (EV) and late vitellogenic oocytes (LV). ((A–D) 200× magnification; (C1,D1) 400× magnification). Males (E) control; 0.1 µg/L; 1 µg/L; 10 µg/L. The spermatocytes included spermatogonia (Sg), spermatocytes (Sc), spermatids (St) and spermatozoa (Sz), Red arrows indicate a widened interstitial space (400× magnification). Percentage (%) of different stages of oocytes in females (F) and spermatogenic cells in males (G). The results are presented as the mean ± SD of three replicates (* p < 0.05; ** p < 0.01).
|
Expression Data
Expression Detail
Antibody Labeling
Phenotype Data
| Fish: | |
|---|---|
| Condition: | |
| Observed In: | |
| Stage: | Adult |
Phenotype Detail
Acknowledgments
This image is the copyrighted work of the attributed author or publisher, and
ZFIN has permission only to display this image to its users.
Additional permissions should be obtained from the applicable author or publisher of the image.
Full text @ Toxics