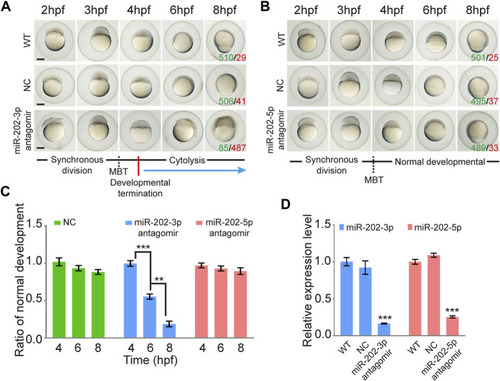
Inhibition of miR-202-3p by an antagomir results in termination of embryonic development at MBT in zebrafish. (A) Time-matched bright field images of embryos showing developmental termination at 4 hpf and, finally, cytolysis after miR-202-3p antagomir (8 µM) injection in the fertilized embryos compared with embryos of wild type and NC embryos injected with scrambled miR-202-3p antagomir (8 µM). The green number indicates the number of embryos with normal development and in red the number indicates the abnormal development. WT embryos at 8hpf were used as phenotypic control. (B) Time-matched bright field images of embryos showing completely normal development of zebrafish embryos injected with miR-202-5p antagomir (8 µM); patterns are similar with what is found for wild type (WT) and NC (scrambled antagomir) injection embryos over the same developmental time course. The green number indicates the number of embryos with normal development and in red the number indicates the abnormal development. WT embryos at 8hpf were used as phenotypic control. (C) The statistics of embryo viability at 4 hpf, 6 hpf and 8 hpf following injection with miR-202-3p antagomir, miR-202-5p antagomir or NC (scrambled antagomir). (D) qRT-PCR analyses showing embryonic content of miR-202-3p and miR-202-5p after treatment with respective antagomirs. The scale bar is 100 µm. Error bars, mean ± s.d., n = 3 (biological replicates).
|

