
Fig. 3
- ID
- ZDB-FIG-220822-11
- Publication
- DeMarco et al., 2022 - A genetic labeling system to study dendritic spine development in zebrafish models of neurodevelopmental disorders
- Other Figures
- All Figure Page
- Back to All Figure Page
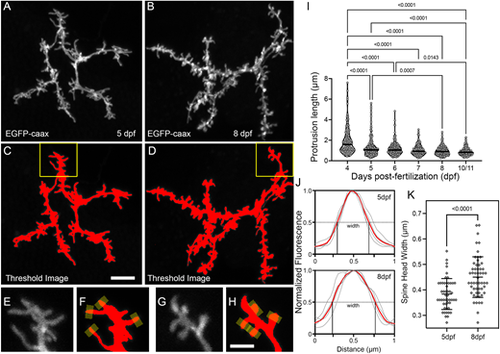
Morphological changes associated with the filopodia-spine transition. (A,B) Maximum projections of apical dendrite subvolumes acquired from a 5 dpf PyrN (A) and an 8 dpf PyrN (B). (C,D) Examples of images in A,B with a low threshold mask applied. (E-H) Magnified views of dendrite subregions indicated by yellow boxes in C and D. Grayscale (E,G) and thresholded (F,H) images are presented for each region. Yellow rectangles at spine tips in F,H indicate 0.5 µm-wide line selections used to generate fluorescence intensity plots across each spine head. (I) Quantification of protrusion lengths for PyrN apical dendrites at 4, 5, 6, 7, 8 and 10/11 dpf. Note gradual decrease in protrusions with lengths greater than 2 µm. The median for each group is indicated by a horizontal line. Number of spines and neurons (indicated in parentheses) analyzed at each timepoint: 123 (6), 225 (7), 214 (7), 137 (5), 187 (5) and 157 (4). One-way ANOVA with Tukey's multiple comparisons test was used to determine significance. All significant differences (P<0.05) are shown on graph. (J) Spine head fluorescence intensity plots for measuring spine head widths. Thin gray traces are for the four spines indicated in F and H. Width was calculated by measuring the width at half-maximum for each trace. The means of these widths for each set is indicated by red traces. (K) Comparison of spine head widths at 5 and 8 dpf. Number of spines and neurons (indicated in parentheses) analyzed at 5 and 8 dpf: 50 (4) and 55 (4). Data are presented as mean±s.d. Significance was determined using a two-tailed unpaired t-test. Scale bars: 5 µm (A-D); 2 µm (E-H). |