|
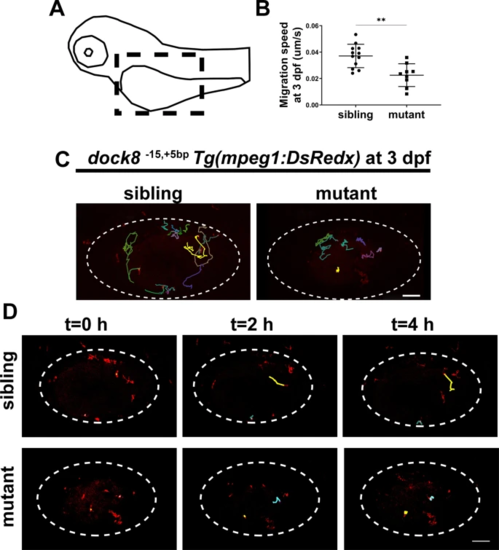
A Schematic diagram of the imaging region. Black dash lines represent the imaging area. B Quantification of migration speed of mpeg1+ cells in dock8-15,+5bp mutants and siblings yolk sac within 4?h from 3?dpf, each dot represents one larva. C Representative images of mpeg1+ cells tracking in dock8-15,+5bp mutants and siblings yolk sac at 3?dpf. Each line represents the migration path of one macrophage. D Time-lapse confocal imaging of Tg(mpeg1:DsRed);dock815,+5bp embryos from 3?dpf within 4?h. Each line represents the migration path of one macrophage. White dotted lines indicate the yolk sac. Scale bar?=?100?�m. See also Video S 1. Data were analyzed by unpaired Student?s t-tests. **P???0.01.
|