
FIGURE
Fig. 8
- ID
- ZDB-FIG-220801-229
- Publication
- Gurung et al., 2022 - Single-cell transcriptomic analysis of vascular endothelial cells in zebrafish embryos
- Other Figures
- All Figure Page
- Back to All Figure Page
Fig. 8
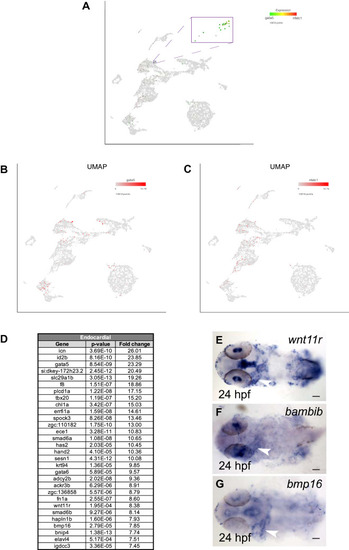
Endocardial subcluster. (A) Endocardial cells were identified based on the expression of markers genes gata5 and nfatc1 (log2 > 0). (B,C) UMAP feature plots showing expression of gata5 and nfatc1. (D) List of top 30 genes differentially expressed in the endocardial subcluster. (E–G) In situ hybridization analysis at 24 hpf for selected endocardial enriched genes wnt11r, bambib and bmp16. Note the expression of wnt11r, bambib and bmp16 within the heart tube (arrowhead). Ventral view of deyolked and flat-mounted embryos, anterior is to the left. Scale bars: 100 μm. |
Expression Data
| Genes: | |
|---|---|
| Fish: | |
| Anatomical Term: | |
| Stage: | Prim-5 |
Expression Detail
Antibody Labeling
Phenotype Data
Phenotype Detail
Acknowledgments
This image is the copyrighted work of the attributed author or publisher, and
ZFIN has permission only to display this image to its users.
Additional permissions should be obtained from the applicable author or publisher of the image.
Full text @ Sci. Rep.