
FIGURE
Fig. 7
- ID
- ZDB-FIG-220801-228
- Publication
- Gurung et al., 2022 - Single-cell transcriptomic analysis of vascular endothelial cells in zebrafish embryos
- Other Figures
- All Figure Page
- Back to All Figure Page
Fig. 7
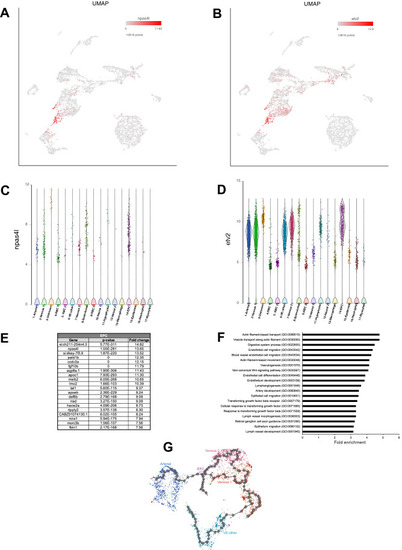
Endothelial progenitor cell (EPC) cluster. (A,B) UMAP plots showing expression of selected EPC top markers npas4l and etv2. (C,D) Violin plots showing expression of selected arterial marker genes npas4l and etv2 in different cell populations. (E) List of top 20 genes differentially expressed in the EPC cluster. (F) List of top 20 pathways enriched in the EPC cluster. (G) Developmental trajectory plot of vascular endothelial cells generated using Monocle 3. |
Expression Data
Expression Detail
Antibody Labeling
Phenotype Data
Phenotype Detail
Acknowledgments
This image is the copyrighted work of the attributed author or publisher, and
ZFIN has permission only to display this image to its users.
Additional permissions should be obtained from the applicable author or publisher of the image.
Full text @ Sci. Rep.