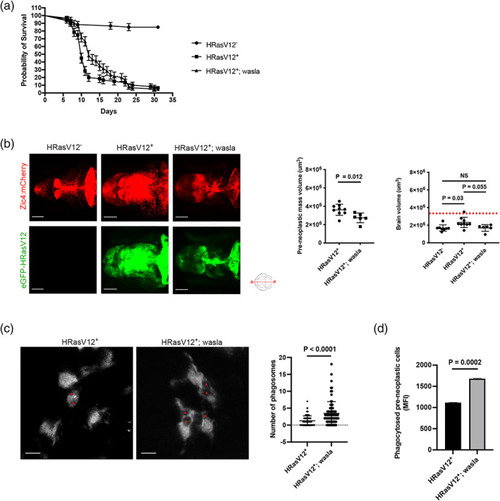
Microglial wasla expression is crucial to slow down tumor progression. (a) Kaplan–Meier survival plot of HRasV12−, HRasV12+ and HRasV12+; wasla larvae control over 31 days, n = 50/60, 4/60 and 3/60, respectively. p = .0017 (Gehan–Breslow–Wilcoxon test between HRasV12+ and HRasV12+; wasla conditions). Error bars represent mean ± SD. (b) Brain and pre‐neoplastic mass volume were measured using the mCherry signal (brain, top panels) and eGFP signal of HRas+ cells (pre‐neoplastic mass; bottom panels) of proliferating regions of the developing brain from 5 dpf HRasV12− (left panel), HRasV12+ (middle panel) and HRasV12+; wasla (right panel) larvae. Scale bar represents 100 μm. Brain and pre‐neoplastic mass volume from 5 dpf HRasV12−, HRasV12+ and HRasV12+; wasla larvae are quantified using Imaris surface tool. HRasV12+: n = 9; HRasV12+; wasla: n = 6; N = 3. Error bars represent mean ± SD. Red dotted line indicates the brain volume mean in control condition. (c) Close‐up confocal images of microglia (mpeg1:eGFP+ cells) from 5 dpf HRasV12+ (left panel) and HRasV12+; wasla (right panel) brains. Phagosomes are indicated by red asterisks. Scale bar represents 10 μm. The number of phagosomes per microglia from 5 dpf HRasV12+ and HRasV12+; wasla brains were quantified. HRasV12+: n = 80; HRasV12+; wasla: n = 80; N = 3. Error bars represent mean ± SD. (d) Mean of GFP fluorescent intensity (MFI) from phagocytosed pre‐neoplastic cells detected by flow cytometry within isolated microglia from 5 dpf HRasV12+ and HRasV12+; wasla larvae. The means ± SD of two independent experiments are plotted. Images were captured using a Zeiss LSM880 confocal microscope with a 20X/NA 0.8 objective. All images represent the maximum intensity projections of Z stacks
|
