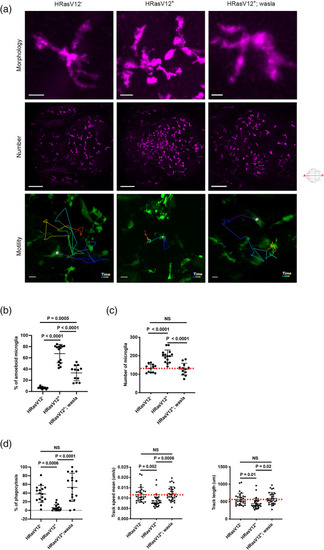
Walsa overexpression in microglia restores their morphology and functions. (a) Close‐up confocal images of microglia (top panels), microglial population (middle panels) and examples of microglia tracks displayed as time color‐coded lines (lower panels) from 5 dpf HRasV12− (left panel), HRasV12+ (middle panel) and HRasV12+; wasla (right panel) brains. Scale bar represents 10, 100 and 20 μm, respectively. (b) The percentage of amoeboid microglia and (c) the total number of microglia from 5 dpf HRasV12−, HRasV12+ and HRasV12+; wasla brains were quantified. HRasV12−: n = 15; HRasV12+: n = 15; HRasV12+; wasla: n = 15; N = 3. Error bars represent mean ± SD. (d) The percentage of phagocytosis within the tectum of 5 dpf HRasV12−, HRasV12+ and HRasV12+; wasla as well as microglia track speed mean and track length (motility) were quantified. Phagocytosis: HRasV12−: n = 16; HRasV12+: n = 16; HRasV12+; wasla: n = 16; N = 3. Motility: HRasV12−: n = 30; HRasV12+: n = 30; HRasV12+; wasla: n = 30; N = 3. Error bars represent mean ± SD. Red dotted lines indicate the number of microglia, track speed mean or track length in control condition. Images were captured using a Zeiss LSM880 confocal microscope with a 20X/NA 0.8 objective. All images represent the maximum intensity projections of Z stacks
|
